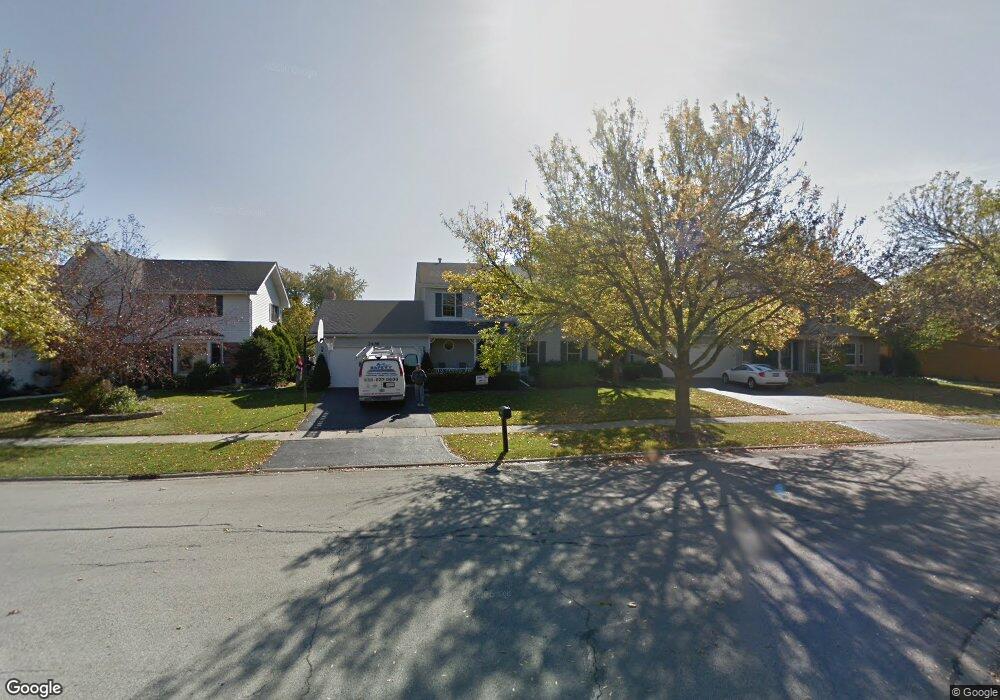
2486 Wendover Dr Naperville, IL 60565
Old Farm NeighborhoodEstimated Value: $568,000 - $599,000
4
Beds
3
Baths
2,106
Sq Ft
$277/Sq Ft
Est. Value
About This Home
This home is located at 2486 Wendover Dr, Naperville, IL 60565 and is currently estimated at $583,770, approximately $277 per square foot. 2486 Wendover Dr is a home located in Will County with nearby schools including Kingsley Elementary School, Lincoln Jr. High School, and Naperville Central High School.
Ownership History
Date
Name
Owned For
Owner Type
Purchase Details
Closed on
Jan 26, 2023
Sold by
Chronister David W and Chronister Kristine M
Bought by
David W Chronister Trust and Kristine M Chronister Trust
Current Estimated Value
Purchase Details
Closed on
Jun 5, 1995
Sold by
Powers Gregory W and Powers Joni M
Bought by
Chronister David W and Chronister Kristine M
Home Financials for this Owner
Home Financials are based on the most recent Mortgage that was taken out on this home.
Original Mortgage
$189,000
Interest Rate
8.27%
Purchase Details
Closed on
Nov 30, 1993
Sold by
Nagel Robert E and Nagel Carolynn J
Bought by
Powers Gregory W and Powers Joni M
Home Financials for this Owner
Home Financials are based on the most recent Mortgage that was taken out on this home.
Original Mortgage
$164,800
Interest Rate
6.82%
Create a Home Valuation Report for This Property
The Home Valuation Report is an in-depth analysis detailing your home's value as well as a comparison with similar homes in the area
Home Values in the Area
Average Home Value in this Area
Purchase History
| Date | Buyer | Sale Price | Title Company |
|---|---|---|---|
| David W Chronister Trust | -- | -- | |
| Chronister David W | $210,000 | -- | |
| Powers Gregory W | $206,000 | -- |
Source: Public Records
Mortgage History
| Date | Status | Borrower | Loan Amount |
|---|---|---|---|
| Previous Owner | Chronister David W | $189,000 | |
| Previous Owner | Powers Gregory W | $164,800 |
Source: Public Records
Tax History Compared to Growth
Tax History
| Year | Tax Paid | Tax Assessment Tax Assessment Total Assessment is a certain percentage of the fair market value that is determined by local assessors to be the total taxable value of land and additions on the property. | Land | Improvement |
|---|---|---|---|---|
| 2024 | $11,355 | $183,996 | $41,136 | $142,860 |
| 2023 | $11,355 | $165,554 | $37,013 | $128,541 |
| 2022 | $10,886 | $149,255 | $33,369 | $115,886 |
| 2021 | $9,192 | $139,556 | $31,201 | $108,355 |
| 2020 | $9,331 | $142,070 | $31,763 | $110,307 |
| 2019 | $9,009 | $135,304 | $30,250 | $105,054 |
| 2018 | $8,595 | $129,502 | $28,953 | $100,549 |
| 2017 | $8,272 | $122,751 | $27,444 | $95,307 |
| 2016 | $8,429 | $123,000 | $27,500 | $95,500 |
| 2015 | $8,764 | $118,000 | $26,400 | $91,600 |
| 2014 | $8,764 | $118,000 | $26,400 | $91,600 |
| 2013 | $8,764 | $109,200 | $24,400 | $84,800 |
Source: Public Records
Map
Nearby Homes
- 2474 Wendover Dr
- 2471 Kingsley Dr
- 51 Ford Ln
- 203 Settlers Ct
- 36 Oak Bluff Ct
- 44 Oak Bluff Ct
- 20 Pinnacle Ct
- 15 Pinnacle Ct
- 284 Westbrook Cir
- 2421 River Woods Dr
- 2697 Fox River Ln
- 92 Salt River Ct
- 327 Danbury Dr
- 2734 Alyssa Dr
- 2575 River Woods Dr
- 221 Hampshire Ct Unit 201D
- 2633 Haddassah Dr
- 2279 Kaskaskia Ct
- 225 Hampshire Ct Unit 101A1
- 94 Cassin Rd
- 2482 Wendover Dr Unit 7
- 2490 Wendover Dr
- 2478 Wendover Dr
- 2494 Wendover Dr
- 100 Ardley Ct
- 101 Ardley Ct
- 2498 Wendover Dr Unit 7
- 2463 W West Branch Ct
- 2459 W West Branch Ct
- 2470 Wendover Dr Unit 7
- 2455 W West Branch Ct
- 2480 Kingsley Dr Unit 7
- 2473 Wendover Dr
- 104 Ardley Ct
- 105 Ardley Ct
- 2466 Wendover Dr
- 2451 W West Branch Ct
- 2474 Kingsley Dr
- 2467 W West Branch Ct
- 108 Ardley Ct