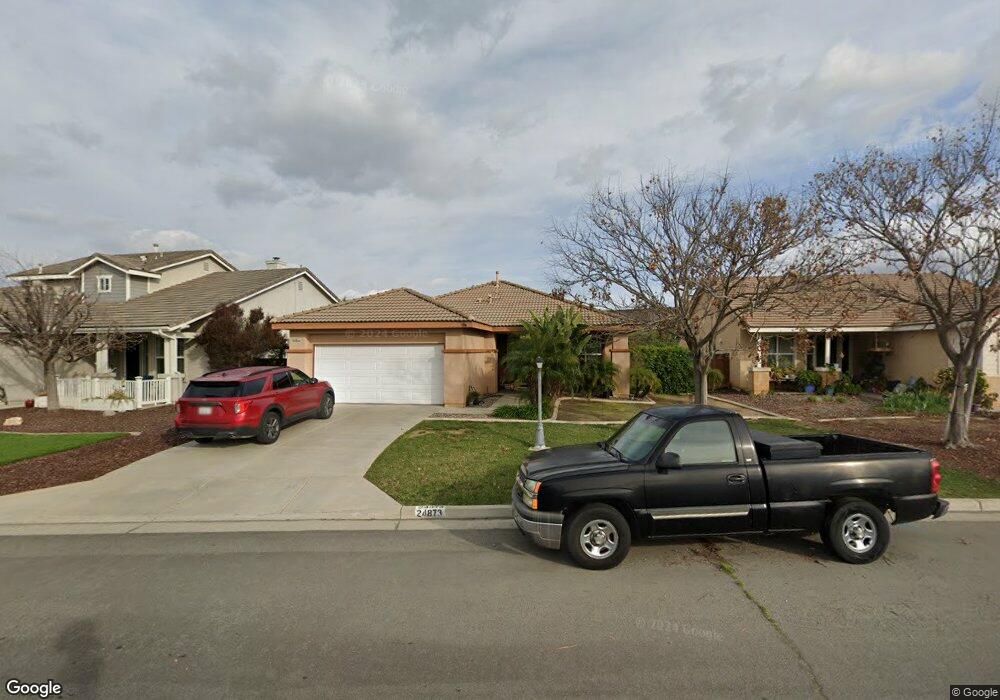
24873 Butterchurn Rd Wildomar, CA 92595
Estimated Value: $515,000 - $627,000
3
Beds
2
Baths
1,604
Sq Ft
$353/Sq Ft
Est. Value
About This Home
This home is located at 24873 Butterchurn Rd, Wildomar, CA 92595 and is currently estimated at $565,534, approximately $352 per square foot. 24873 Butterchurn Rd is a home located in Riverside County with nearby schools including Ronald Reagan Elementary School, David A. Brown Middle School, and Elsinore High School.
Ownership History
Date
Name
Owned For
Owner Type
Purchase Details
Closed on
Sep 12, 2011
Sold by
Maier Nciole Marie and Maier Benjamin A
Bought by
Felando Anton L and Felando Natalie L
Current Estimated Value
Home Financials for this Owner
Home Financials are based on the most recent Mortgage that was taken out on this home.
Original Mortgage
$155,944
Interest Rate
4.37%
Mortgage Type
FHA
Purchase Details
Closed on
Nov 22, 2005
Sold by
The Farm Associates Llc
Bought by
Maier Benjamin A and Maier Nicole Marie
Home Financials for this Owner
Home Financials are based on the most recent Mortgage that was taken out on this home.
Original Mortgage
$266,300
Interest Rate
5.75%
Mortgage Type
Purchase Money Mortgage
Create a Home Valuation Report for This Property
The Home Valuation Report is an in-depth analysis detailing your home's value as well as a comparison with similar homes in the area
Home Values in the Area
Average Home Value in this Area
Purchase History
| Date | Buyer | Sale Price | Title Company |
|---|---|---|---|
| Felando Anton L | $160,000 | Lawyers Title Company | |
| Maier Benjamin A | $333,000 | First American Title Company |
Source: Public Records
Mortgage History
| Date | Status | Borrower | Loan Amount |
|---|---|---|---|
| Previous Owner | Felando Anton L | $155,944 | |
| Previous Owner | Maier Benjamin A | $266,300 |
Source: Public Records
Tax History Compared to Growth
Tax History
| Year | Tax Paid | Tax Assessment Tax Assessment Total Assessment is a certain percentage of the fair market value that is determined by local assessors to be the total taxable value of land and additions on the property. | Land | Improvement |
|---|---|---|---|---|
| 2025 | $2,888 | $200,954 | $75,355 | $125,599 |
| 2023 | $2,888 | $193,153 | $72,430 | $120,723 |
| 2022 | $2,823 | $189,366 | $71,010 | $118,356 |
| 2021 | $2,785 | $185,654 | $69,618 | $116,036 |
| 2020 | $2,765 | $183,752 | $68,905 | $114,847 |
| 2019 | $2,728 | $180,150 | $67,554 | $112,596 |
| 2018 | $2,691 | $176,619 | $66,231 | $110,388 |
| 2017 | $2,655 | $173,157 | $64,933 | $108,224 |
| 2016 | $2,588 | $169,762 | $63,660 | $106,102 |
| 2015 | $2,563 | $167,213 | $62,704 | $104,509 |
| 2014 | $2,507 | $163,940 | $61,477 | $102,463 |
Source: Public Records
Map
Nearby Homes
- 24884 Butterchurn Rd
- 33828 Plowshare Rd
- 33990 Harvest Way
- 33853 Plowshare Rd
- 34159 Olive Grove Rd
- 33922 Windmill Rd
- 33910 Windmill Rd
- 33680 Harvest Way E
- 34252 Harrow Hill Rd
- 34370 The Farm Rd
- 33653 Windmill Rd
- Residence Two Plan at Heritage Crossings
- Residence One Plan at Heritage Crossings
- 24800 Cornstalk Rd
- 33571 Windmill Rd
- 34261 The Farm Rd
- 33449 Mill Pond Dr
- 33415 Furrow Ct
- 33429 Harvest Way E
- 33500 Hayloft St
- 24881 Butterchurn Rd
- 24869 Butterchurn Rd
- 24889 Butterchurn Rd
- 24857 Butterchurn Rd
- 33972 Applecart Ct
- 24905 Butterchurn Rd
- 24849 Butterchurn Rd
- 24921 Butterchurn Rd
- 33964 Applecart Ct
- 33977 Applecart Ct
- 24841 Butterchurn Rd
- 24900 Butterchurn Rd
- 33969 Applecart Ct
- 33948 Applecart Ct
- 24908 Butterchurn Rd
- 33961 Applecart Ct
- 24937 Butterchurn Rd
- 24828 Butterchurn Rd
- 33940 Applecart Ct
- 24916 Butterchurn Rd