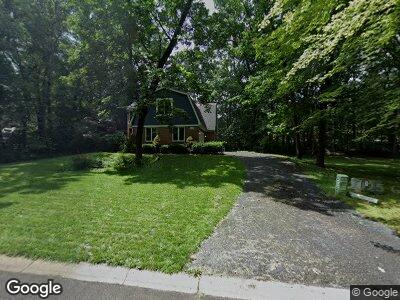
2489 Rocky Top Ct Unit Bldg-Unit Commerce Township, MI 48382
Estimated Value: $504,000 - $687,000
4
Beds
3
Baths
2,968
Sq Ft
$194/Sq Ft
Est. Value
About This Home
This home is located at 2489 Rocky Top Ct Unit Bldg-Unit, Commerce Township, MI 48382 and is currently estimated at $576,030, approximately $194 per square foot. 2489 Rocky Top Ct Unit Bldg-Unit is a home located in Oakland County with nearby schools including Country Oaks Elementary School, Oak Valley Middle School, and Wixom Christian School.
Ownership History
Date
Name
Owned For
Owner Type
Purchase Details
Closed on
Feb 5, 2018
Sold by
Thoelcke Amber and Thoelcke Toby
Bought by
Campbell Charles A and Campbell Stephanie A
Current Estimated Value
Home Financials for this Owner
Home Financials are based on the most recent Mortgage that was taken out on this home.
Original Mortgage
$284,400
Interest Rate
3.99%
Mortgage Type
New Conventional
Purchase Details
Closed on
Apr 13, 2010
Sold by
Gour Richard E and Gour Jan T
Bought by
Federal Home Loan Mortgage Corp
Purchase Details
Closed on
Aug 28, 1997
Sold by
Conflitti Toni
Bought by
Gour Richard E
Home Financials for this Owner
Home Financials are based on the most recent Mortgage that was taken out on this home.
Original Mortgage
$235,800
Interest Rate
7.44%
Create a Home Valuation Report for This Property
The Home Valuation Report is an in-depth analysis detailing your home's value as well as a comparison with similar homes in the area
Home Values in the Area
Average Home Value in this Area
Purchase History
| Date | Buyer | Sale Price | Title Company |
|---|---|---|---|
| Campbell Charles A | $316,000 | Ata National Title Group Llc | |
| Federal Home Loan Mortgage Corp | $166,500 | None Available | |
| Gour Richard E | $262,000 | -- |
Source: Public Records
Mortgage History
| Date | Status | Borrower | Loan Amount |
|---|---|---|---|
| Open | Campbell Charles A | $219,206 | |
| Closed | Campbell Charles A | $284,400 | |
| Previous Owner | Thoelcke Amber | $156,824 | |
| Previous Owner | Thoelcke Toby | $150,000 | |
| Previous Owner | Thoelcke Toby | $130,000 | |
| Previous Owner | Thoelcke Toby | $110,000 | |
| Previous Owner | Gour Richard E | $235,800 |
Source: Public Records
Tax History Compared to Growth
Tax History
| Year | Tax Paid | Tax Assessment Tax Assessment Total Assessment is a certain percentage of the fair market value that is determined by local assessors to be the total taxable value of land and additions on the property. | Land | Improvement |
|---|---|---|---|---|
| 2024 | $4,412 | $220,360 | $0 | $0 |
| 2023 | $4,208 | $201,930 | $0 | $0 |
| 2022 | $6,059 | $185,990 | $0 | $0 |
| 2021 | $5,688 | $184,590 | $0 | $0 |
| 2020 | $3,853 | $179,740 | $0 | $0 |
| 2019 | $5,406 | $166,810 | $0 | $0 |
| 2018 | $3,709 | $153,450 | $0 | $0 |
| 2017 | $3,639 | $153,450 | $0 | $0 |
| 2016 | $3,587 | $146,270 | $0 | $0 |
| 2015 | -- | $141,380 | $0 | $0 |
| 2014 | -- | $126,440 | $0 | $0 |
| 2011 | -- | $116,560 | $0 | $0 |
Source: Public Records
Map
Nearby Homes
- 2457 Rocky Top Ln
- 170 Meadows Cir W Unit 170
- 98 Meadows Cir Unit 98
- 189 Pepperidge Dr Unit 189
- 3896 Corran Dr
- 3490 Mare Cir
- 2931 Colt Ct
- 0000 Foal Blvd
- 2252 Hall Ln Unit 396
- 3553 Barberry Cir
- 2610 Ironton Dr
- 2735 Tulip Way
- 1699 Brentwood Dr
- 2030 Emerald Ln
- 2785 Trillium Hills Dr
- 2670 Ironton Dr
- 2675 Ironton Dr
- 2785 Tulip Way
- 2485 Solace Dr
- 2525 Childs Lake Rd
- 2489 Rocky Top Ct Unit Bldg-Unit
- 2489 Rocky Top Ct Unit 9
- 2479 Rocky Top Ct Unit 8
- 2519 Rocky Top Ct
- 2515 Marion Acres St
- 2465 Rocky Top Ct
- 2488 Rocky Top Ct Unit 4
- 2518 Rocky Top Ct
- 0 Willow Way Dr
- 2466 Rocky Top Ct
- 2478 Rocky Top Ct
- 2537 Rocky Top Ct
- 2542 Rocky Top Ct
- 2521 Marion Acres St
- 2513 Marion Acres St
- 2517 Marion Acres St
- 2563 Rocky Top Ct
- 2459 Rocky Top Ln
- 2600 Rocky Top Ct
- 2505 Marion Acres St