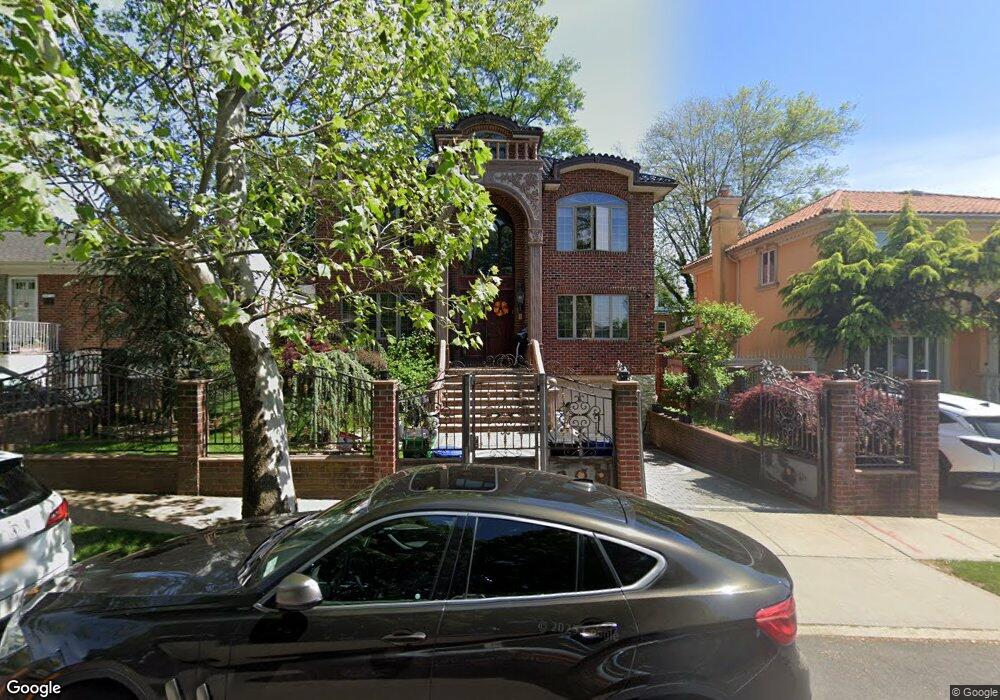
249-18 52nd Ave Flushing, NY 11362
Little Neck NeighborhoodEstimated Value: $1,837,771 - $2,136,000
3
Beds
4
Baths
2,398
Sq Ft
$820/Sq Ft
Est. Value
About This Home
This home is located at 249-18 52nd Ave, Flushing, NY 11362 and is currently estimated at $1,967,193, approximately $820 per square foot. 249-18 52nd Ave is a home located in Queens County with nearby schools including P.S. 94 - David D. Porter, Louis Pasteur Middle School 67, and Benjamin N Cardozo High School.
Ownership History
Date
Name
Owned For
Owner Type
Purchase Details
Closed on
Aug 19, 2024
Sold by
Shayevich Alexander and Shayevich Jonathan
Bought by
Shayevich Trustee Zhanna Kalen and The Shayevich Revocable Trust
Current Estimated Value
Purchase Details
Closed on
Aug 5, 2021
Sold by
Sun Ying and Sun Tom Ben
Bought by
Kalen-Shayevich Zhanna and Shayevich Alexander
Home Financials for this Owner
Home Financials are based on the most recent Mortgage that was taken out on this home.
Original Mortgage
$750,000
Interest Rate
2.9%
Mortgage Type
Purchase Money Mortgage
Purchase Details
Closed on
Nov 2, 2005
Sold by
Ginsberg Edward and Ginsberg Lloyd
Bought by
Sun Ying and Sun Tom Ben
Home Financials for this Owner
Home Financials are based on the most recent Mortgage that was taken out on this home.
Original Mortgage
$220,000
Interest Rate
6.07%
Purchase Details
Closed on
Aug 24, 2004
Sold by
Ginsberg Shirley
Bought by
Ginsberg Edward and Ginsberg Lloyd
Create a Home Valuation Report for This Property
The Home Valuation Report is an in-depth analysis detailing your home's value as well as a comparison with similar homes in the area
Home Values in the Area
Average Home Value in this Area
Purchase History
| Date | Buyer | Sale Price | Title Company |
|---|---|---|---|
| Shayevich Trustee Zhanna Kalen | -- | -- | |
| Kalen-Shayevich Zhanna | $1,800,000 | -- | |
| Kalen-Shayevich Zhanna | $1,800,000 | -- | |
| Sun Ying | $798,000 | -- | |
| Sun Ying | $798,000 | -- | |
| Ginsberg Edward | -- | -- | |
| Ginsberg Edward | -- | -- |
Source: Public Records
Mortgage History
| Date | Status | Borrower | Loan Amount |
|---|---|---|---|
| Previous Owner | Kalen-Shayevich Zhanna | $750,000 | |
| Previous Owner | Sun Ying | $220,000 | |
| Previous Owner | Sun Ying | $358,000 |
Source: Public Records
Tax History Compared to Growth
Tax History
| Year | Tax Paid | Tax Assessment Tax Assessment Total Assessment is a certain percentage of the fair market value that is determined by local assessors to be the total taxable value of land and additions on the property. | Land | Improvement |
|---|---|---|---|---|
| 2025 | $15,047 | $76,909 | $14,399 | $62,510 |
| 2024 | $15,047 | $74,918 | $15,573 | $59,345 |
| 2023 | $14,568 | $72,530 | $15,259 | $57,271 |
| 2022 | $13,928 | $70,320 | $17,760 | $52,560 |
| 2021 | $13,852 | $65,820 | $17,760 | $48,060 |
| 2020 | $13,566 | $65,580 | $17,760 | $47,820 |
| 2019 | $13,060 | $66,300 | $17,760 | $48,540 |
| 2018 | $12,321 | $60,442 | $13,912 | $46,530 |
| 2017 | $12,233 | $60,009 | $15,130 | $44,879 |
| 2016 | $11,317 | $60,009 | $15,130 | $44,879 |
| 2015 | $6,658 | $53,409 | $15,266 | $38,143 |
| 2014 | $6,658 | $52,027 | $17,134 | $34,893 |
Source: Public Records
Map
Nearby Homes
- 249-35 51st Ave
- 5110 248th St
- 25104 51st Ave
- 249-14 Cambria Ave
- 57-03 Marathon Pkwy Unit 250 (Lower)
- 53-15 251st Place
- 249-42 57th Ave Unit 2
- 57-66 246th Crescent Unit F8
- 249-30 57th Ave Unit 1
- 249-52 57th Ave Unit 1-245
- 57- 45 Marathon Pkwy Unit Uppr
- 57-47 246th Crescent Unit 1
- 5006 Marathon Pkwy
- 58- 20 251st St Unit 2nd floor
- 53-34 Browvale Ln
- 58-28 251st St Unit 2
- 50-43 Morenci Ln
- 58- 30 251st St Unit 2nd
- 5022 Overbrook St
- 245-84 62 Ave Unit B1-1
- 24918 52nd Ave
- 24924 52nd Ave
- 24914 52nd Ave
- 24928 52nd Ave
- 24919 Thornhill Ave
- 24919 Thornhill Ave
- 24921 Thornhill Ave
- 24911 Thornhill Ave
- 249-21 Thornhill Ave
- 52-09 Marathon Pkwy
- 5209 Marathon Pkwy
- 24904 52nd Ave
- 24904 52nd Ave
- 25005 Thornhill Ave
- 24934 52nd Ave
- 5215 Marathon Pkwy
- 5215 Marathon Pkwy
- 249-34 52nd Ave
- 249-19 52nd Ave
- 24919 52nd Ave