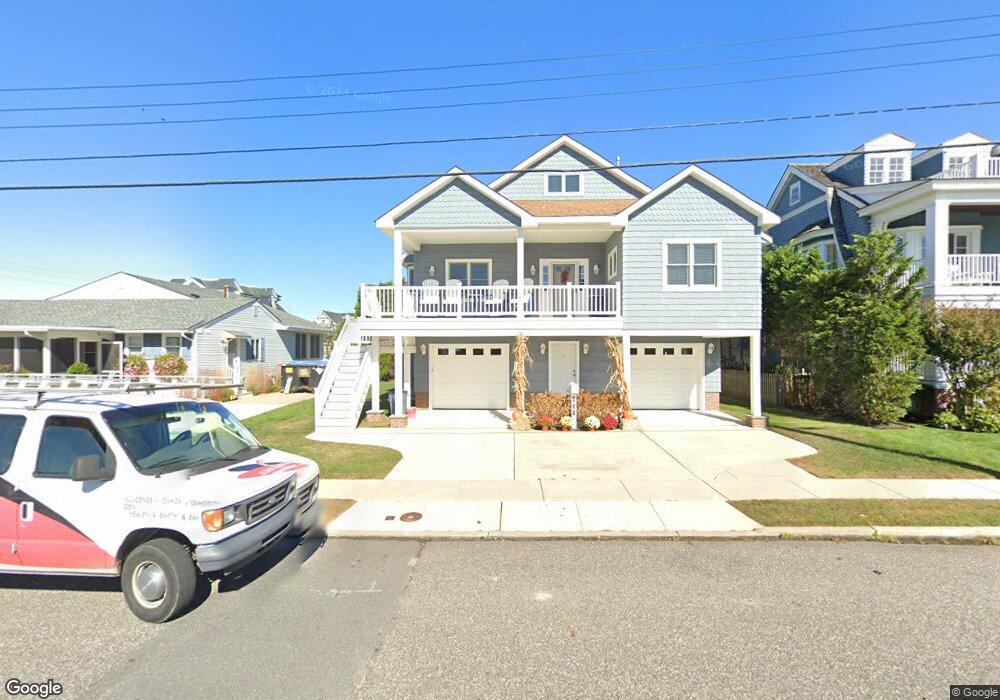
249 49th St Avalon, NJ 08202
Estimated Value: $3,133,000 - $3,983,000
Studio
--
Bath
2,660
Sq Ft
$1,278/Sq Ft
Est. Value
About This Home
This home is located at 249 49th St, Avalon, NJ 08202 and is currently estimated at $3,399,636, approximately $1,278 per square foot. 249 49th St is a home with nearby schools including Avalon Elementary School.
Ownership History
Date
Name
Owned For
Owner Type
Purchase Details
Closed on
Sep 8, 2010
Sold by
Davison Charles Spencer
Bought by
Davison Charles S and Davison Sue
Current Estimated Value
Purchase Details
Closed on
Apr 23, 1990
Sold by
Davison Noreen A
Bought by
Davison Charles S
Create a Home Valuation Report for This Property
The Home Valuation Report is an in-depth analysis detailing your home's value as well as a comparison with similar homes in the area
Home Values in the Area
Average Home Value in this Area
Purchase History
| Date | Buyer | Sale Price | Title Company |
|---|---|---|---|
| Davison Charles S | -- | None Available | |
| Davison Charles S | -- | -- |
Source: Public Records
Tax History Compared to Growth
Tax History
| Year | Tax Paid | Tax Assessment Tax Assessment Total Assessment is a certain percentage of the fair market value that is determined by local assessors to be the total taxable value of land and additions on the property. | Land | Improvement |
|---|---|---|---|---|
| 2025 | $9,968 | $1,623,400 | $900,000 | $723,400 |
| 2024 | $9,968 | $1,623,400 | $900,000 | $723,400 |
| 2023 | $9,887 | $1,623,400 | $900,000 | $723,400 |
| 2022 | $9,221 | $1,623,400 | $900,000 | $723,400 |
| 2021 | $8,871 | $1,623,400 | $900,000 | $723,400 |
| 2020 | $8,539 | $1,623,400 | $900,000 | $723,400 |
| 2019 | $8,279 | $1,623,400 | $900,000 | $723,400 |
| 2018 | $7,922 | $1,623,400 | $900,000 | $723,400 |
| 2017 | $7,580 | $1,363,300 | $720,000 | $643,300 |
| 2016 | $7,498 | $1,363,300 | $720,000 | $643,300 |
| 2015 | $7,375 | $1,363,300 | $720,000 | $643,300 |
| 2014 | $7,294 | $1,363,300 | $720,000 | $643,300 |
Source: Public Records
Map
Nearby Homes