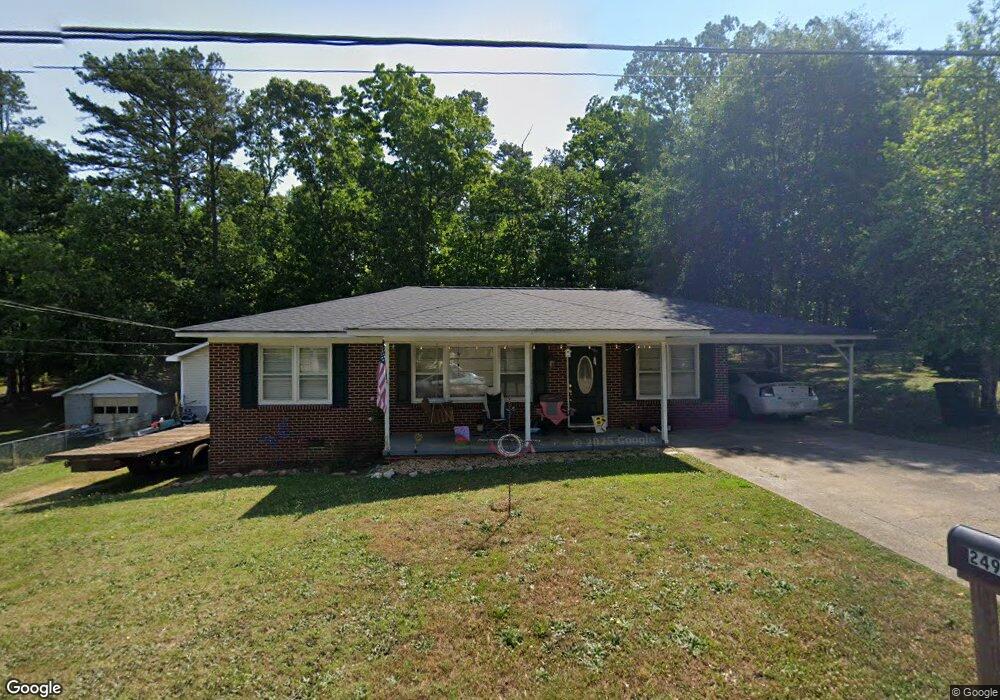
249 Hilltop Ln Toccoa, GA 30577
Estimated Value: $188,000 - $202,882
3
Beds
1
Bath
1,317
Sq Ft
$150/Sq Ft
Est. Value
About This Home
This home is located at 249 Hilltop Ln, Toccoa, GA 30577 and is currently estimated at $197,471, approximately $149 per square foot. 249 Hilltop Ln is a home located in Stephens County with nearby schools including Stephens County High School.
Ownership History
Date
Name
Owned For
Owner Type
Purchase Details
Closed on
Jun 21, 2019
Sold by
Fuller Ronny D
Bought by
Carter Brandon Lee
Current Estimated Value
Home Financials for this Owner
Home Financials are based on the most recent Mortgage that was taken out on this home.
Original Mortgage
$100,505
Outstanding Balance
$87,630
Interest Rate
4%
Mortgage Type
New Conventional
Estimated Equity
$109,841
Purchase Details
Closed on
Mar 27, 2006
Sold by
Mcduffie Jeremiah D
Bought by
Fuller Ronny D
Home Financials for this Owner
Home Financials are based on the most recent Mortgage that was taken out on this home.
Original Mortgage
$66,280
Interest Rate
6.23%
Mortgage Type
New Conventional
Purchase Details
Closed on
May 7, 2004
Bought by
<Buyer Info Not Present>
Purchase Details
Closed on
Sep 25, 2001
Bought by
<Buyer Info Not Present>
Purchase Details
Closed on
Sep 26, 2000
Bought by
<Buyer Info Not Present>
Purchase Details
Closed on
Nov 1, 1985
Bought by
<Buyer Info Not Present>
Create a Home Valuation Report for This Property
The Home Valuation Report is an in-depth analysis detailing your home's value as well as a comparison with similar homes in the area
Purchase History
| Date | Buyer | Sale Price | Title Company |
|---|---|---|---|
| Carter Brandon Lee | $99,500 | -- | |
| Fuller Ronny D | $89,100 | -- | |
| <Buyer Info Not Present> | -- | -- | |
| <Buyer Info Not Present> | -- | -- | |
| <Buyer Info Not Present> | $55,000 | -- | |
| <Buyer Info Not Present> | $25,200 | -- |
Source: Public Records
Mortgage History
| Date | Status | Borrower | Loan Amount |
|---|---|---|---|
| Open | Carter Brandon Lee | $100,505 | |
| Previous Owner | Fuller Ronny D | $66,280 |
Source: Public Records
Tax History
| Year | Tax Paid | Tax Assessment Tax Assessment Total Assessment is a certain percentage of the fair market value that is determined by local assessors to be the total taxable value of land and additions on the property. | Land | Improvement |
|---|---|---|---|---|
| 2025 | $2,397 | $68,694 | $2,082 | $66,612 |
| 2024 | $1,604 | $45,007 | $2,082 | $42,925 |
| 2023 | $1,478 | $41,780 | $2,082 | $39,698 |
| 2022 | $1,171 | $39,348 | $2,082 | $37,266 |
| 2021 | $1,169 | $37,384 | $2,082 | $35,302 |
| 2020 | $1,178 | $37,298 | $2,082 | $35,216 |
| 2019 | $814 | $25,660 | $2,082 | $23,578 |
| 2018 | $814 | $25,660 | $2,082 | $23,578 |
| 2017 | $827 | $25,660 | $2,082 | $23,578 |
| 2016 | $813 | $25,629 | $2,081 | $23,548 |
| 2015 | $971 | $29,228 | $2,081 | $27,146 |
| 2014 | $1,012 | $29,962 | $2,082 | $27,880 |
| 2013 | -- | $29,961 | $2,081 | $27,880 |
Source: Public Records
Map
Nearby Homes
- 253 Stancil Dr
- 122 King St
- 0 Stephen Dr Unit 10710969
- 0 Stephen Dr Unit 10710891
- 0 Valley Dr Unit 10701357
- 27 Hilltop Ln
- 481 Collins Rd
- 9 Poplar St
- 526 Poplar St
- 59 Sunset Ln
- 704 Skyline Dr
- 288 Davis Ave
- 207 Poplar Trail
- 30 Moore Ave
- 93 Hickory Cir
- 372 Hilltop Way
- 926 Skyline Dr
- 208 Cherry St
- 820 Collier Rd
- 128 Branch St
Your Personal Tour Guide
Ask me questions while you tour the home.