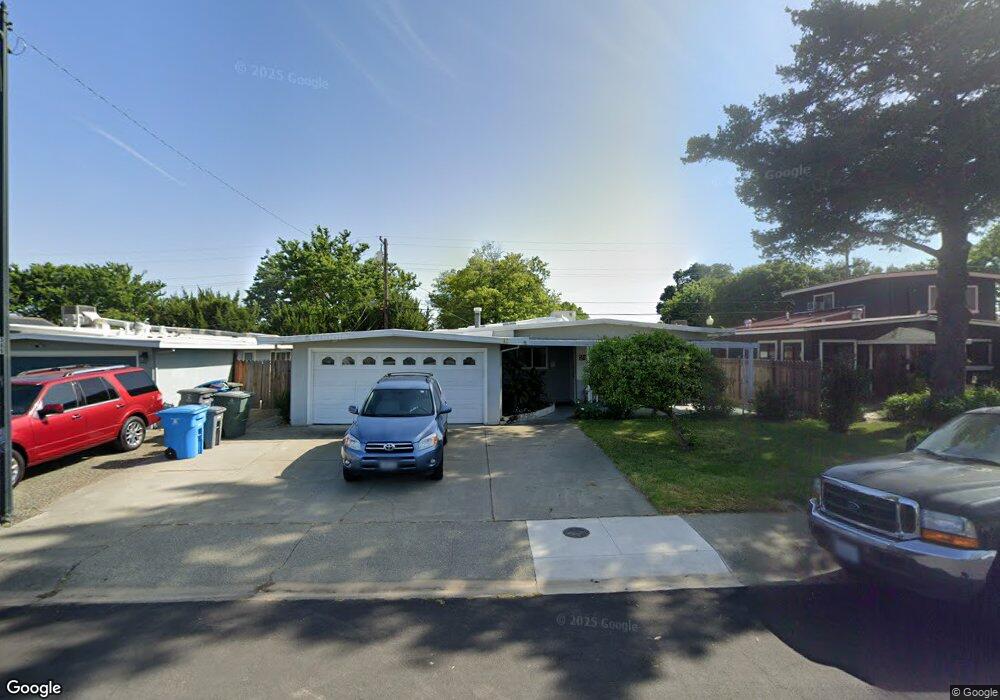
249 Juniper St Vacaville, CA 95688
Estimated Value: $470,000 - $536,000
3
Beds
2
Baths
1,334
Sq Ft
$375/Sq Ft
Est. Value
About This Home
This home is located at 249 Juniper St, Vacaville, CA 95688 and is currently estimated at $500,162, approximately $374 per square foot. 249 Juniper St is a home located in Solano County with nearby schools including Hemlock Elementary School, Orchard Elementary School, and Willis Jepson Middle School.
Ownership History
Date
Name
Owned For
Owner Type
Purchase Details
Closed on
May 6, 2014
Sold by
Legaspi Edwin
Bought by
Legaspi Edwin S
Current Estimated Value
Purchase Details
Closed on
Oct 10, 2012
Sold by
Mcneil Shawn
Bought by
Legaspi Edwin
Purchase Details
Closed on
Jan 20, 2010
Sold by
Mcneil Shawn and Mcneil Karen
Bought by
Mcneil Shawn
Purchase Details
Closed on
Feb 28, 2007
Sold by
Deavers Diann L
Bought by
Mcneil Shawn and Mcneil Karen
Home Financials for this Owner
Home Financials are based on the most recent Mortgage that was taken out on this home.
Original Mortgage
$32,100
Interest Rate
5.97%
Mortgage Type
Stand Alone Second
Purchase Details
Closed on
Jan 26, 1996
Sold by
Deavers Pluma
Bought by
Deavers Henry G
Purchase Details
Closed on
Jan 16, 1996
Sold by
Deavers Henry C and Deavers Pluma H
Bought by
Deavers Henry C and Deavers Pluma H
Create a Home Valuation Report for This Property
The Home Valuation Report is an in-depth analysis detailing your home's value as well as a comparison with similar homes in the area
Purchase History
| Date | Buyer | Sale Price | Title Company |
|---|---|---|---|
| Legaspi Edwin S | -- | None Available | |
| Legaspi Edwin | $149,000 | First American Title Company | |
| Mcneil Shawn | -- | Accommodation | |
| Mcneil Shawn | $325,000 | First American Title Co | |
| Deavers Henry G | -- | -- | |
| Deavers Henry C | -- | -- | |
| Deavers Henry C | -- | -- |
Source: Public Records
Mortgage History
| Date | Status | Borrower | Loan Amount |
|---|---|---|---|
| Previous Owner | Mcneil Shawn | $32,100 | |
| Previous Owner | Mcneil Shawn | $260,000 |
Source: Public Records
Tax History
| Year | Tax Paid | Tax Assessment Tax Assessment Total Assessment is a certain percentage of the fair market value that is determined by local assessors to be the total taxable value of land and additions on the property. | Land | Improvement |
|---|---|---|---|---|
| 2025 | $2,117 | $183,473 | $49,252 | $134,221 |
| 2024 | $2,117 | $179,877 | $48,287 | $131,590 |
| 2023 | $2,068 | $176,351 | $47,341 | $129,010 |
| 2022 | $2,014 | $172,894 | $46,413 | $126,481 |
| 2021 | $2,018 | $169,504 | $45,503 | $124,001 |
| 2020 | $1,991 | $167,767 | $45,037 | $122,730 |
| 2019 | $2,057 | $164,478 | $44,154 | $120,324 |
| 2018 | $1,935 | $161,254 | $43,289 | $117,965 |
| 2017 | $1,871 | $158,093 | $42,441 | $115,652 |
| 2016 | $1,855 | $154,994 | $41,609 | $113,385 |
| 2015 | $1,909 | $152,666 | $40,984 | $111,682 |
| 2014 | $1,716 | $149,677 | $40,182 | $109,495 |
Source: Public Records
Map
Nearby Homes
- 507 Stinson Ave
- 572 Eldridge Ave
- 530 Eldridge Ave
- 317 Grape St
- 345 Eldridge Ave
- 239 Deodara St
- 848 Fruit Stand Cir
- 324 Woodside Cir
- 136 Marco Ln
- 449 Cordoba Ln
- 456 Buckeye St
- 6526 Gibson Canyon Rd
- 2036 Zinfandel Ct
- 3001 Chardonnay Ct
- 591 Arlene Dr
- 366 Peach Tree Ave
- 436 Corte Lagos
- 216 Alta Mira Dr
- 2136 Vineyard Hills Ct
- 448 Corte Lagos
Your Personal Tour Guide
Ask me questions while you tour the home.