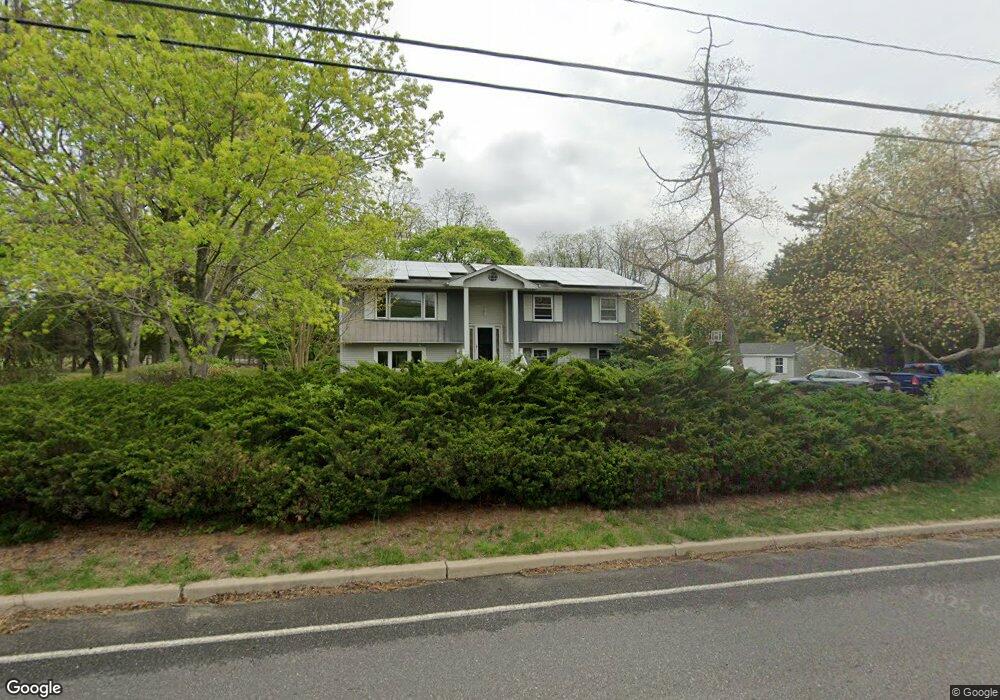
249 Kent Rd Howell, NJ 07731
Southard NeighborhoodEstimated Value: $679,000 - $772,000
4
Beds
1
Bath
2,628
Sq Ft
$268/Sq Ft
Est. Value
About This Home
This home is located at 249 Kent Rd, Howell, NJ 07731 and is currently estimated at $705,374, approximately $268 per square foot. 249 Kent Rd is a home located in Monmouth County with nearby schools including Taunton School, Aldrich School, and Howell Township Middle School South.
Ownership History
Date
Name
Owned For
Owner Type
Purchase Details
Closed on
Jun 18, 2001
Sold by
Dlabik Charles
Bought by
Noble Mark and Noble Gail
Current Estimated Value
Home Financials for this Owner
Home Financials are based on the most recent Mortgage that was taken out on this home.
Original Mortgage
$105,900
Interest Rate
6.77%
Create a Home Valuation Report for This Property
The Home Valuation Report is an in-depth analysis detailing your home's value as well as a comparison with similar homes in the area
Home Values in the Area
Average Home Value in this Area
Purchase History
| Date | Buyer | Sale Price | Title Company |
|---|---|---|---|
| Noble Mark | $225,900 | -- |
Source: Public Records
Mortgage History
| Date | Status | Borrower | Loan Amount |
|---|---|---|---|
| Previous Owner | Noble Mark | $105,900 |
Source: Public Records
Tax History
| Year | Tax Paid | Tax Assessment Tax Assessment Total Assessment is a certain percentage of the fair market value that is determined by local assessors to be the total taxable value of land and additions on the property. | Land | Improvement |
|---|---|---|---|---|
| 2025 | $8,067 | $546,200 | $260,600 | $285,600 |
| 2024 | $7,745 | $453,700 | $173,400 | $280,300 |
Source: Public Records
Map
Nearby Homes
- 42 Brown Rd
- 57 Church Rd
- 29 Sweet Gum Rd
- 41 Sweet Gum Rd
- 53 Sweet Gum Rd
- 47 Sweet Gum Rd
- 9 Hawk Ct
- 40 Brookwood Pkwy
- 3 Colorado Dr
- 1501 Pine Park Ave
- 652 Hope Chapel Rd
- 8 Trinity Place
- 100 Avis Ave
- 269 Alexander Ave
- 254 Alexander Ave
- 270 Alexander Ave
- 606 W Kennedy Blvd
- 132 Saint Katherine Place
- 23 Sami Dr
- 901 Bethel Church Rd
Your Personal Tour Guide
Ask me questions while you tour the home.