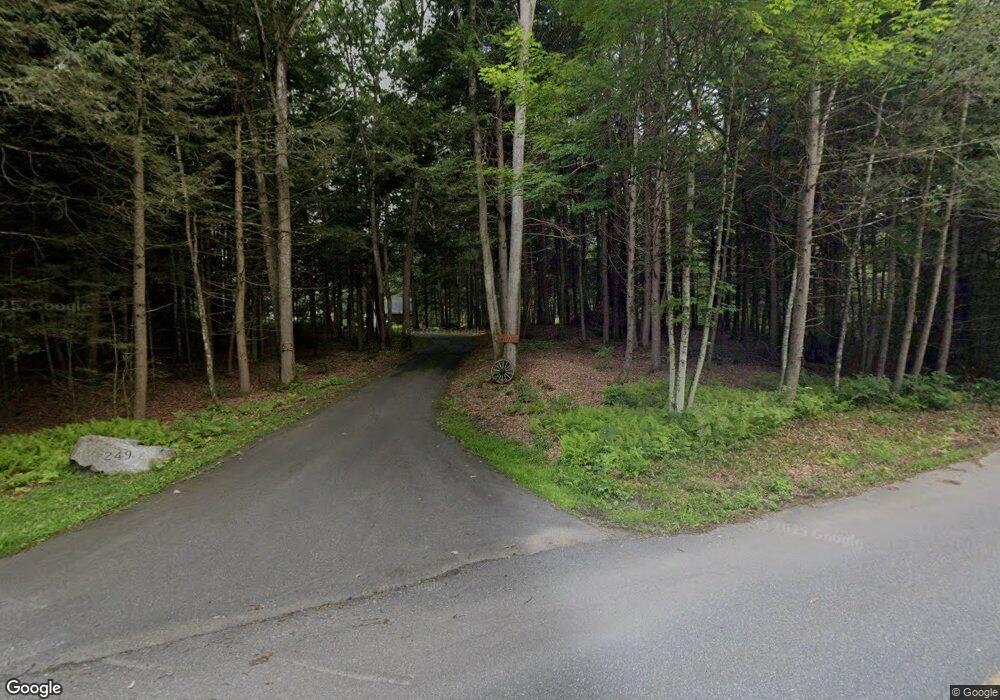
249 Linseed Rd West Hatfield, MA 01088
Estimated Value: $402,000 - $628,480
2
Beds
2
Baths
3,020
Sq Ft
$174/Sq Ft
Est. Value
About This Home
This home is located at 249 Linseed Rd, West Hatfield, MA 01088 and is currently estimated at $526,620, approximately $174 per square foot. 249 Linseed Rd is a home located in Hampshire County with nearby schools including Browerville Elementary School and Brooklyn Center Middle School.
Ownership History
Date
Name
Owned For
Owner Type
Purchase Details
Closed on
Mar 18, 2025
Sold by
Picard Barry J
Bought by
Picard Barry J and Picard Lori A
Current Estimated Value
Purchase Details
Closed on
Jan 2, 2025
Sold by
Landru Diane K Est and Picard
Bought by
Clark Melissa and Picard Barry
Purchase Details
Closed on
May 2, 2023
Sold by
Landry Diane and Picard Barry J
Bought by
Picard Barry J and Picard Lori A
Home Financials for this Owner
Home Financials are based on the most recent Mortgage that was taken out on this home.
Original Mortgage
$257,500
Interest Rate
4.5%
Mortgage Type
Purchase Money Mortgage
Purchase Details
Closed on
Feb 19, 2020
Sold by
Landry Diane K
Bought by
Landry Diane K
Purchase Details
Closed on
Feb 29, 2012
Sold by
Landry Diane K
Bought by
Landry Diane K
Purchase Details
Closed on
Jan 15, 2010
Sold by
Eps Hampshire Nt
Bought by
Landry Diane K
Create a Home Valuation Report for This Property
The Home Valuation Report is an in-depth analysis detailing your home's value as well as a comparison with similar homes in the area
Home Values in the Area
Average Home Value in this Area
Purchase History
| Date | Buyer | Sale Price | Title Company |
|---|---|---|---|
| Picard Barry J | -- | None Available | |
| Picard Barry J | -- | None Available | |
| Picard Barry J | $15,000 | None Available | |
| Picard Barry J | $15,000 | None Available | |
| Clark Melissa | -- | None Available | |
| Clark Melissa | -- | None Available | |
| Clark Melissa | -- | None Available | |
| Picard Barry J | $515,000 | None Available | |
| Picard Barry J | $515,000 | None Available | |
| Picard Barry J | $515,000 | None Available | |
| Landry Diane K | -- | None Available | |
| Landry Diane K | -- | -- | |
| Landry Diane K | $30,000 | -- | |
| Landry Diane K | $30,000 | -- |
Source: Public Records
Mortgage History
| Date | Status | Borrower | Loan Amount |
|---|---|---|---|
| Previous Owner | Picard Barry J | $257,500 |
Source: Public Records
Tax History Compared to Growth
Tax History
| Year | Tax Paid | Tax Assessment Tax Assessment Total Assessment is a certain percentage of the fair market value that is determined by local assessors to be the total taxable value of land and additions on the property. | Land | Improvement |
|---|---|---|---|---|
| 2025 | $7,796 | $563,325 | $212,225 | $351,100 |
| 2024 | $8,106 | $529,432 | $194,132 | $335,300 |
| 2023 | $6,010 | $445,840 | $137,840 | $308,000 |
| 2022 | $5,896 | $431,340 | $133,340 | $298,000 |
| 2021 | $5,991 | $422,174 | $129,174 | $293,000 |
| 2020 | $5,712 | $422,174 | $129,174 | $293,000 |
| 2019 | $5,354 | $385,485 | $105,385 | $280,100 |
| 2018 | $5,086 | $374,516 | $104,716 | $269,800 |
| 2017 | $4,869 | $368,299 | $99,499 | $268,800 |
| 2016 | $4,726 | $358,556 | $94,856 | $263,700 |
| 2015 | $4,711 | $357,692 | $94,092 | $263,600 |
| 2014 | $4,551 | $359,214 | $93,614 | $265,600 |
Source: Public Records
Map
Nearby Homes
- 0 Pantry Rd Unit 73430264
- 182 Old Stage Rd
- 121 West St
- LOT D Mountain Rd
- 147 Pantry Rd
- 0 Old Stage Rd Unit 73394977
- 151 Pantry Rd
- 2B Linseed Rd
- 37 N Farms Rd
- 320 West St
- 45 N Farms Rd
- 34 Gore Ave
- 0 Straits Rd
- 21 Dwight St
- 43 Laurel Park Unit 43
- 66 Laurel Park Unit 66
- 12 Dwight St
- 93 Laurel Park Unit 93
- 18 Elm St
- 32 Stonewall Dr