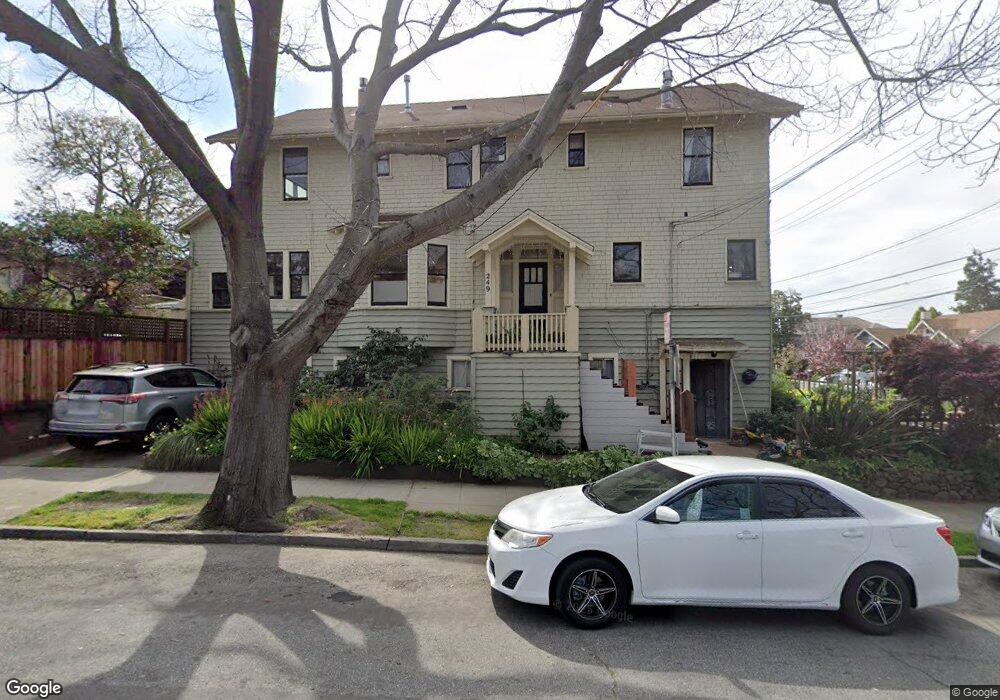
249 Mather St Oakland, CA 94611
Piedmont Avenue NeighborhoodEstimated Value: $1,005,000 - $1,810,000
4
Beds
2
Baths
2,359
Sq Ft
$643/Sq Ft
Est. Value
About This Home
This home is located at 249 Mather St, Oakland, CA 94611 and is currently estimated at $1,515,756, approximately $642 per square foot. 249 Mather St is a home located in Alameda County with nearby schools including Piedmont Avenue Elementary School, Westlake Middle School, and Oakland Technical High School.
Ownership History
Date
Name
Owned For
Owner Type
Purchase Details
Closed on
May 14, 2024
Sold by
Gilles Rose
Bought by
Rose M Gilles 2024 Revocable Trust and Gilles
Current Estimated Value
Purchase Details
Closed on
Jan 23, 2017
Sold by
Batiste Lora M
Bought by
Batiste Lora and Lora Batiste Living Trust
Purchase Details
Closed on
Nov 2, 2004
Sold by
Batiste Lora M and Cuttenden Jeffrey C
Bought by
Rose Batiste Lora and Rose Gilles
Purchase Details
Closed on
Jan 30, 2002
Sold by
Duncan George R and Duncan Susan A
Bought by
Batiste Lora M and Cruttenden Jeffrey C
Home Financials for this Owner
Home Financials are based on the most recent Mortgage that was taken out on this home.
Original Mortgage
$360,000
Interest Rate
6.62%
Purchase Details
Closed on
Jun 24, 1994
Sold by
Duncan George R and Duncan Susan A
Bought by
Duncan George R and Duncan Susan
Create a Home Valuation Report for This Property
The Home Valuation Report is an in-depth analysis detailing your home's value as well as a comparison with similar homes in the area
Home Values in the Area
Average Home Value in this Area
Purchase History
| Date | Buyer | Sale Price | Title Company |
|---|---|---|---|
| Rose M Gilles 2024 Revocable Trust | -- | None Listed On Document | |
| Batiste Lora | -- | None Available | |
| Rose Batiste Lora | -- | Alliance Title Company | |
| Batiste Lora M | $450,000 | Old Republic Title Company | |
| Duncan George R | -- | -- |
Source: Public Records
Mortgage History
| Date | Status | Borrower | Loan Amount |
|---|---|---|---|
| Previous Owner | Batiste Lora M | $360,000 |
Source: Public Records
Tax History
| Year | Tax Paid | Tax Assessment Tax Assessment Total Assessment is a certain percentage of the fair market value that is determined by local assessors to be the total taxable value of land and additions on the property. | Land | Improvement |
|---|---|---|---|---|
| 2025 | $10,639 | $702,570 | $212,871 | $496,699 |
| 2024 | $10,639 | $688,660 | $208,698 | $486,962 |
| 2023 | $11,289 | $682,022 | $204,606 | $477,416 |
| 2022 | $10,878 | $661,650 | $200,595 | $468,055 |
| 2021 | $10,424 | $648,541 | $196,662 | $458,879 |
| 2020 | $10,309 | $648,821 | $194,646 | $454,175 |
| 2019 | $9,936 | $636,102 | $190,830 | $445,272 |
| 2018 | $9,726 | $623,633 | $187,090 | $436,543 |
| 2017 | $9,360 | $611,408 | $183,422 | $427,986 |
| 2016 | $9,064 | $599,424 | $179,827 | $419,597 |
| 2015 | $9,015 | $590,421 | $177,126 | $413,295 |
| 2014 | $9,096 | $578,860 | $173,658 | $405,202 |
Source: Public Records
Map
Nearby Homes
- 4395 Piedmont Ave Unit P208
- 159 John St
- 4970 Coronado Ave
- 4949 Coronado Ave
- 328 Glendale Ave
- 133 Echo Ave
- 5335 Broadway Terrace Unit 301
- 5335 Broadway Terrace Unit 204
- 1006 Rose Ave
- 5340 Broadway Terrace Unit 301
- 382 50th St
- 11 Parkside Dr
- 5115 Lawton Ave
- 4045 Manila Ave
- 359 41st St
- 5405 Carlton St Unit 303
- 367 41st St
- 1 Kelton Ct Unit 8J
- 5460 Carlton St
- 4067 Shafter Ave
Your Personal Tour Guide
Ask me questions while you tour the home.