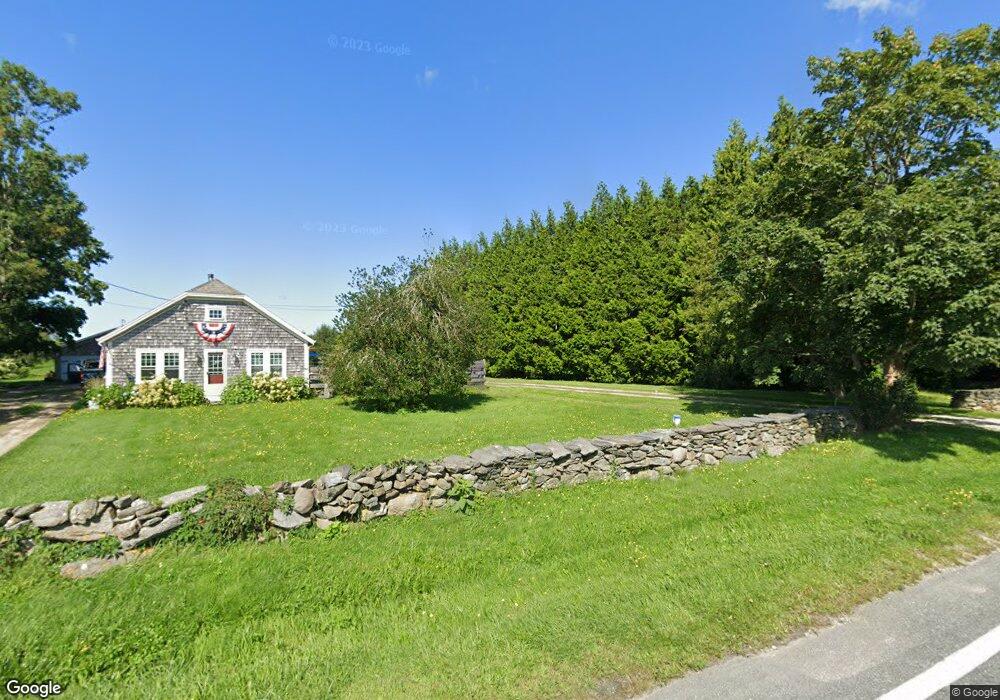
249 W Main Rd Little Compton, RI 02837
Estimated Value: $1,329,000 - $1,974,000
3
Beds
3
Baths
3,055
Sq Ft
$545/Sq Ft
Est. Value
About This Home
This home is located at 249 W Main Rd, Little Compton, RI 02837 and is currently estimated at $1,665,810, approximately $545 per square foot. 249 W Main Rd is a home located in Newport County with nearby schools including Wilbur & McMahon School.
Ownership History
Date
Name
Owned For
Owner Type
Purchase Details
Closed on
Oct 21, 2021
Sold by
Kristen A Humphrey Lt and Humphrey
Bought by
Humphrey Richard S
Current Estimated Value
Home Financials for this Owner
Home Financials are based on the most recent Mortgage that was taken out on this home.
Original Mortgage
$850,000
Outstanding Balance
$770,883
Interest Rate
3.01%
Mortgage Type
New Conventional
Estimated Equity
$894,927
Create a Home Valuation Report for This Property
The Home Valuation Report is an in-depth analysis detailing your home's value as well as a comparison with similar homes in the area
Home Values in the Area
Average Home Value in this Area
Purchase History
| Date | Buyer | Sale Price | Title Company |
|---|---|---|---|
| Humphrey Richard S | -- | None Available | |
| Humphrey Richard S | -- | None Available |
Source: Public Records
Mortgage History
| Date | Status | Borrower | Loan Amount |
|---|---|---|---|
| Open | Humphrey Richard S | $850,000 | |
| Closed | Humphrey Richard S | $850,000 |
Source: Public Records
Tax History
| Year | Tax Paid | Tax Assessment Tax Assessment Total Assessment is a certain percentage of the fair market value that is determined by local assessors to be the total taxable value of land and additions on the property. | Land | Improvement |
|---|---|---|---|---|
| 2025 | $6,870 | $1,434,200 | $819,400 | $614,800 |
| 2024 | $5,358 | $1,054,700 | $472,300 | $582,400 |
| 2023 | $5,231 | $1,054,700 | $472,300 | $582,400 |
| 2022 | $5,168 | $1,054,700 | $472,300 | $582,400 |
| 2021 | $4,957 | $820,700 | $410,700 | $410,000 |
| 2020 | $4,749 | $792,800 | $410,700 | $382,100 |
| 2019 | $4,701 | $792,800 | $410,700 | $382,100 |
| 2018 | $4,785 | $802,800 | $410,700 | $392,100 |
| 2016 | $4,552 | $802,800 | $410,700 | $392,100 |
| 2015 | $4,541 | $789,800 | $373,400 | $416,400 |
| 2014 | $4,454 | $789,800 | $373,400 | $416,400 |
Source: Public Records
Map
Nearby Homes
Your Personal Tour Guide
Ask me questions while you tour the home.