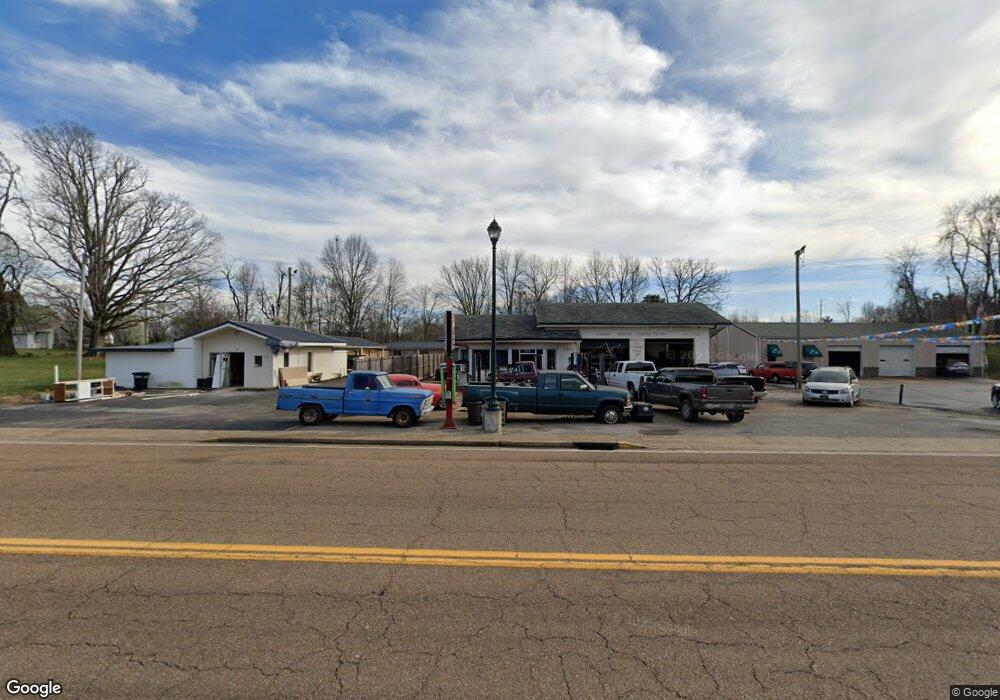
249 W Main St Parsons, TN 38363
Estimated Value: $110,000 - $347,000
--
Bed
--
Bath
5,480
Sq Ft
$42/Sq Ft
Est. Value
About This Home
This home is located at 249 W Main St, Parsons, TN 38363 and is currently estimated at $227,519, approximately $41 per square foot. 249 W Main St is a home located in Decatur County with nearby schools including Parsons Elementary School, Decaturville Elementary School, and Decatur County Middle School.
Ownership History
Date
Name
Owned For
Owner Type
Purchase Details
Closed on
Jul 21, 2016
Sold by
Patel Sunil Kumar
Bought by
Patel Manishaben Nichal
Current Estimated Value
Home Financials for this Owner
Home Financials are based on the most recent Mortgage that was taken out on this home.
Original Mortgage
$112,500
Outstanding Balance
$50,321
Interest Rate
3.56%
Mortgage Type
New Conventional
Estimated Equity
$177,198
Purchase Details
Closed on
May 6, 2011
Sold by
Olmstead Ron
Bought by
Patel Sunil Kumar and Patel Jigisha Sunil
Home Financials for this Owner
Home Financials are based on the most recent Mortgage that was taken out on this home.
Original Mortgage
$145,000
Interest Rate
4.85%
Mortgage Type
Commercial
Purchase Details
Closed on
Aug 27, 2008
Sold by
Patel Raskin D
Bought by
Olmstead Ron
Purchase Details
Closed on
Apr 1, 1980
Bought by
Patel Pravinkumar and Patel Ranjanbala
Purchase Details
Closed on
Jan 1, 1980
Create a Home Valuation Report for This Property
The Home Valuation Report is an in-depth analysis detailing your home's value as well as a comparison with similar homes in the area
Home Values in the Area
Average Home Value in this Area
Purchase History
| Date | Buyer | Sale Price | Title Company |
|---|---|---|---|
| Patel Manishaben Nichal | $150,000 | -- | |
| Patel Sunil Kumar | $175,000 | -- | |
| Olmstead Ron | $175,000 | -- | |
| Patel Raskin D | $152,000 | -- | |
| Patel Pravinkumar | -- | -- | |
| -- | $95,000 | -- |
Source: Public Records
Mortgage History
| Date | Status | Borrower | Loan Amount |
|---|---|---|---|
| Open | Patel Manishaben Nichal | $112,500 | |
| Closed | Patel Manishaben Nichal | $12,500 | |
| Previous Owner | Patel Sunil Kumar | $145,000 |
Source: Public Records
Tax History Compared to Growth
Tax History
| Year | Tax Paid | Tax Assessment Tax Assessment Total Assessment is a certain percentage of the fair market value that is determined by local assessors to be the total taxable value of land and additions on the property. | Land | Improvement |
|---|---|---|---|---|
| 2025 | -- | $112,400 | $0 | $0 |
| 2024 | -- | $86,120 | $32,600 | $53,520 |
| 2023 | $2,825 | $86,120 | $32,600 | $53,520 |
| 2022 | $2,954 | $86,120 | $32,600 | $53,520 |
| 2021 | $2,911 | $84,880 | $32,600 | $52,280 |
| 2020 | $2,911 | $84,880 | $32,600 | $52,280 |
| 2019 | $2,535 | $80,480 | $32,760 | $47,720 |
| 2018 | $2,326 | $80,480 | $32,760 | $47,720 |
| 2017 | $2,367 | $80,480 | $32,760 | $47,720 |
| 2016 | $2,383 | $80,480 | $32,760 | $47,720 |
| 2015 | $2,382 | $80,480 | $32,760 | $47,720 |
| 2014 | $2,382 | $80,466 | $0 | $0 |
Source: Public Records
Map
Nearby Homes