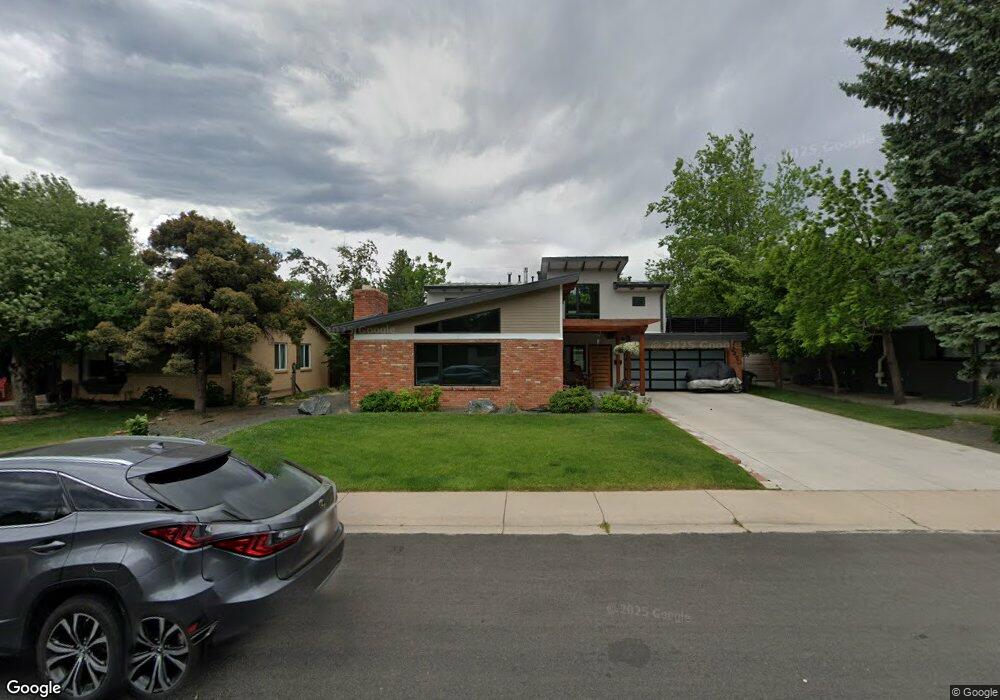
2490 Hawthorn Ave Boulder, CO 80304
Central Boulder NeighborhoodEstimated Value: $1,375,000 - $1,681,000
3
Beds
4
Baths
2,399
Sq Ft
$644/Sq Ft
Est. Value
About This Home
This home is located at 2490 Hawthorn Ave, Boulder, CO 80304 and is currently estimated at $1,544,763, approximately $643 per square foot. 2490 Hawthorn Ave is a home located in Boulder County with nearby schools including Columbine Elementary School, Casey Middle School, and Boulder High School.
Ownership History
Date
Name
Owned For
Owner Type
Purchase Details
Closed on
Jun 3, 2019
Sold by
Bopp Jon C and Bopp Beth E
Bought by
Jon C Bopp Revocable Trust and Beth E Bopp Revocable Trust
Current Estimated Value
Purchase Details
Closed on
Jun 27, 2014
Sold by
The Jon C Bopp Revocable Trust
Bought by
Bopp Jon C
Home Financials for this Owner
Home Financials are based on the most recent Mortgage that was taken out on this home.
Original Mortgage
$250,000
Outstanding Balance
$190,568
Interest Rate
4.18%
Mortgage Type
Credit Line Revolving
Estimated Equity
$1,354,195
Purchase Details
Closed on
Mar 21, 2013
Sold by
Bopp Jon C and Bopp Beth E
Bought by
The Jon C Bopp Revocable Trust and The Beth E Bopp Revocable Trust
Purchase Details
Closed on
Jun 29, 1982
Bought by
Bopp Jon C and Bopp Beth E
Purchase Details
Closed on
Oct 21, 1976
Bought by
Bopp Jon C and Bopp Beth E
Create a Home Valuation Report for This Property
The Home Valuation Report is an in-depth analysis detailing your home's value as well as a comparison with similar homes in the area
Home Values in the Area
Average Home Value in this Area
Purchase History
| Date | Buyer | Sale Price | Title Company |
|---|---|---|---|
| Jon C Bopp Revocable Trust | -- | None Available | |
| Bopp Jon C | -- | None Available | |
| The Jon C Bopp Revocable Trust | -- | None Available | |
| Bopp Jon C | $92,500 | -- | |
| Bopp Jon C | -- | -- |
Source: Public Records
Mortgage History
| Date | Status | Borrower | Loan Amount |
|---|---|---|---|
| Open | Bopp Jon C | $250,000 |
Source: Public Records
Tax History Compared to Growth
Tax History
| Year | Tax Paid | Tax Assessment Tax Assessment Total Assessment is a certain percentage of the fair market value that is determined by local assessors to be the total taxable value of land and additions on the property. | Land | Improvement |
|---|---|---|---|---|
| 2025 | $7,896 | $90,831 | $51,900 | $38,931 |
| 2024 | $7,896 | $90,831 | $51,900 | $38,931 |
| 2023 | $7,759 | $96,547 | $55,041 | $45,192 |
| 2022 | $7,019 | $75,582 | $42,180 | $33,402 |
| 2021 | $6,693 | $77,756 | $43,393 | $34,363 |
| 2020 | $5,825 | $66,917 | $48,477 | $18,440 |
| 2019 | $5,736 | $66,917 | $48,477 | $18,440 |
| 2018 | $4,918 | $56,722 | $35,784 | $20,938 |
| 2017 | $4,764 | $62,709 | $39,561 | $23,148 |
| 2016 | $4,816 | $55,632 | $37,730 | $17,902 |
| 2015 | $4,560 | $34,395 | $17,114 | $17,281 |
| 2014 | $2,892 | $34,395 | $17,114 | $17,281 |
Source: Public Records
Map
Nearby Homes
- 2435 Hawthorn Ave
- 2595 Glenwood Dr
- 3160 Folsom St
- 2540 Iris Ave
- 2636 Juniper Ave Unit 1
- 2636 Juniper Ave Unit 391
- 2595 Juniper Ave
- 3055 23rd St
- 2707 Valmont Rd Unit 304A
- 2707 Valmont Rd Unit 106 Bonus!
- 2707 Valmont Rd Unit 205D
- 2652 Sherwood Cir
- 3255 20th St
- 3515 28th St Unit 108
- 3515 28th St Unit 103
- 2623 Sherwood Cir
- 2901 Lorraine Ct
- 3535 28th St Unit 202
- 3535 28th St Unit 203
- 2006 Joslyn Place
- 2510 Hawthorn Ave
- 2460 Hawthorn Ave
- 2515 Grape Ave
- 2515 Grape Ave Unit B
- 2495 Grape Ave
- 2530 Hawthorn Ave
- 2430 Hawthorn Ave
- 2535 Grape Ave
- 2435 Grape Ave
- 2560 Hawthorn Ave
- 2410 Hawthorn Ave
- 2565 Grape Ave
- 3310 25th St
- 2415 Grape Ave
- 2595 Hawthorn Ave
- 2490 Grape Ave
- 2510 Grape Ave
- 3330 25th St
- 2460 Grape Ave
- 2590 Hawthorn Ave