2491 Mango Way Del Mar, CA 92014
Del Mar Heights NeighborhoodEstimated Value: $1,570,000 - $2,847,006
3
Beds
2
Baths
2,205
Sq Ft
$1,089/Sq Ft
Est. Value
About This Home
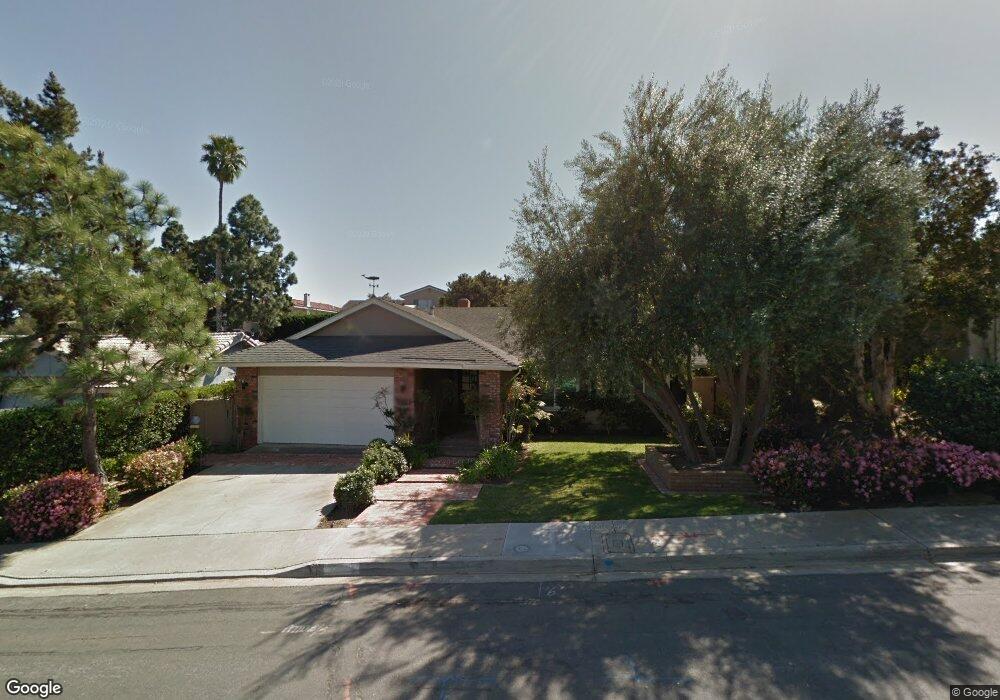
This home is located at 2491 Mango Way, Del Mar, CA 92014 and is currently estimated at $2,402,002, approximately $1,089 per square foot. 2491 Mango Way is a home located in San Diego County with nearby schools including Del Mar Hills Elementary School, Del Mar Heights School, and Earl Warren Middle School.
Ownership History
Date
Name
Owned For
Owner Type
Purchase Details
Closed on
Aug 25, 2020
Sold by
Hubbard Judith
Bought by
Hubbard Judith E and Judith Hubbard Family Trust
Current Estimated Value
Purchase Details
Closed on
Jul 13, 2001
Sold by
Hubbard Judith
Bought by
Hubbard Judith
Home Financials for this Owner
Home Financials are based on the most recent Mortgage that was taken out on this home.
Original Mortgage
$338,300
Interest Rate
6.62%
Purchase Details
Closed on
Aug 21, 1997
Sold by
Hubbard Clinton and Hubbard Judith
Bought by
Hubbard Judith
Purchase Details
Closed on
Jul 24, 1990
Purchase Details
Closed on
Dec 24, 1984
Create a Home Valuation Report for This Property
The Home Valuation Report is an in-depth analysis detailing your home's value as well as a comparison with similar homes in the area
Home Values in the Area
Average Home Value in this Area
Purchase History
We collect this data history from publicly available records. To have your information removed, we recommend requesting removal directly through your county’s website.
| Date | Buyer | Sale Price | Title Company |
|---|---|---|---|
| Hubbard Judith E | -- | None Available | |
| Hubbard Judith | -- | Benefit Land Title Company | |
| Hubbard Judith | -- | -- | |
| -- | $379,500 | -- | |
| -- | $177,900 | -- |
Source: Public Records
Mortgage History
We collect this data history from publicly available records. To have your information removed, we recommend requesting removal directly through your county’s website.
| Date | Status | Borrower | Loan Amount |
|---|---|---|---|
| Previous Owner | Hubbard Judith | $338,300 |
Source: Public Records
Tax History
| Year | Tax Paid | Tax Assessment Tax Assessment Total Assessment is a certain percentage of the fair market value that is determined by local assessors to be the total taxable value of land and additions on the property. | Land | Improvement |
|---|---|---|---|---|
| 2025 | $8,480 | $744,287 | $559,141 | $185,146 |
| 2024 | $7,797 | $729,694 | $548,178 | $181,516 |
| 2023 | $7,623 | $715,387 | $537,430 | $177,957 |
| 2022 | $7,498 | $701,361 | $526,893 | $174,468 |
| 2021 | $7,220 | $687,610 | $516,562 | $171,048 |
| 2020 | $7,282 | $680,561 | $511,266 | $169,295 |
| 2019 | $8,536 | $667,218 | $501,242 | $165,976 |
| 2018 | $8,215 | $654,136 | $491,414 | $162,722 |
| 2017 | $8,064 | $641,311 | $481,779 | $159,532 |
| 2016 | $7,843 | $628,737 | $472,333 | $156,404 |
| 2015 | $7,755 | $619,294 | $465,239 | $154,055 |
| 2014 | $6,240 | $607,164 | $456,126 | $151,038 |
Source: Public Records
Map
Nearby Homes
- 2969 Racetrack View Dr
- 13995 Mira Montana Dr
- 13936 Mira Montana Dr
- 622 Kalamath Dr
- 1411 Via Alta
- 14042 Rue Monaco
- 555 Amphitheatre Dr
- 3580 Seahorn Cir Unit 22
- 612 8th St
- 3539 Voyager Cir Unit 15
- 13754 Mango Dr Unit 315
- 13754 Mango Dr Unit 123
- 13754 Mango Dr Unit 316
- 13788 Ruette le Parc Unit D
- 13765 Mango Dr
- 13743 Recuerdo Dr
- 3744 Newcrest Point
- 386 13th St
- 13721 Pine Needles Dr
- 328 9th St
- 2482 Pinewood St
- 2498 Pinewood St
- 2499 Mango Way
- 2505 Mango Way
- 2502 Pinewood St
- 14255 Pinewood Dr
- 2483 Mango Way
- 2513 Mango Way
- 2485 Pinewood St
- 2501 Pinewood St
- 2521 Mango Way
- 14270 Pinewood Dr
- 2512 Pinewood St
- 2475 Mango Way
- 14262 Pinewood Dr
- 14249 Pinewood Dr
- 00000 Mango Way
- 14298 Mango Dr
- 14256 Pinewood Dr
- 2467 Mango Way
Your Personal Tour Guide
Ask me questions while you tour the home.