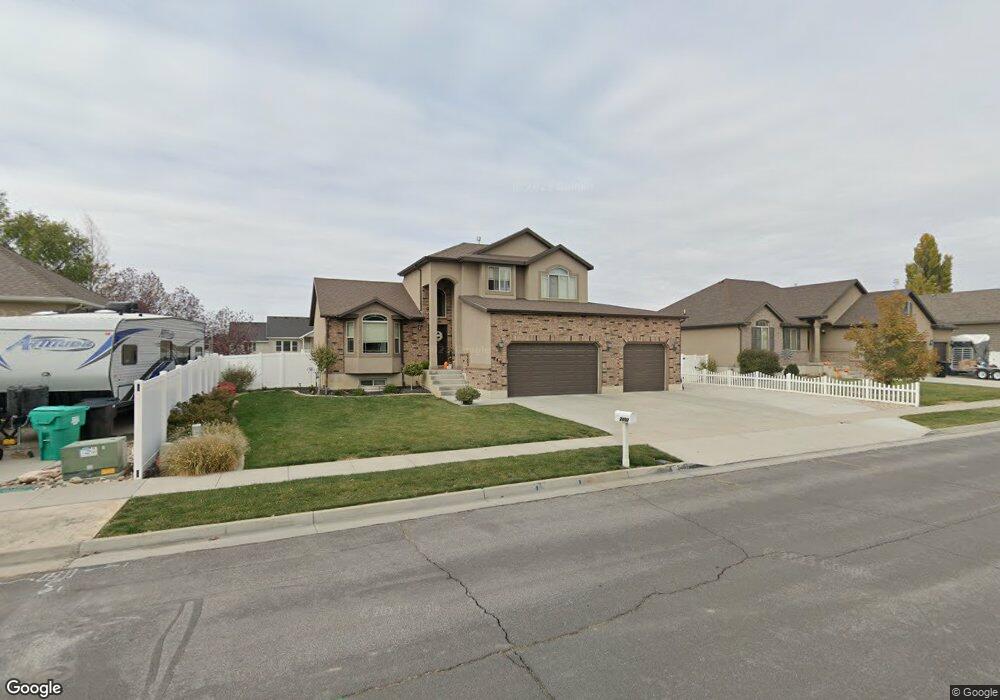
2492 S 1950 W Syracuse, UT 84075
Estimated Value: $617,000 - $671,000
4
Beds
4
Baths
3,036
Sq Ft
$212/Sq Ft
Est. Value
About This Home
This home is located at 2492 S 1950 W, Syracuse, UT 84075 and is currently estimated at $644,393, approximately $212 per square foot. 2492 S 1950 W is a home located in Davis County with nearby schools including Syracuse Elementary School, Syracuse Junior High School, and Syracuse High School.
Ownership History
Date
Name
Owned For
Owner Type
Purchase Details
Closed on
Aug 3, 2016
Sold by
Allen Christopher D
Bought by
Gill Jason C and Gill Marjorie M
Current Estimated Value
Purchase Details
Closed on
Oct 18, 2013
Sold by
Cook Kimberly A and Cook Thurman W
Bought by
Allen Christopher D
Home Financials for this Owner
Home Financials are based on the most recent Mortgage that was taken out on this home.
Original Mortgage
$286,900
Interest Rate
4.55%
Mortgage Type
VA
Purchase Details
Closed on
Feb 28, 2012
Sold by
Dhi Builders Llc
Bought by
Cook Kimberley A and Cook Thurman W
Home Financials for this Owner
Home Financials are based on the most recent Mortgage that was taken out on this home.
Original Mortgage
$234,602
Interest Rate
3.87%
Mortgage Type
FHA
Purchase Details
Closed on
Aug 24, 2011
Sold by
Hark Associates Llc
Bought by
Dhi Builders Llc and Destiny Homes
Create a Home Valuation Report for This Property
The Home Valuation Report is an in-depth analysis detailing your home's value as well as a comparison with similar homes in the area
Home Values in the Area
Average Home Value in this Area
Purchase History
| Date | Buyer | Sale Price | Title Company |
|---|---|---|---|
| Gill Jason C | -- | Backman Title | |
| Allen Christopher D | -- | Hickman Land Title Co | |
| Cook Kimberley A | -- | Mountain View Title | |
| Dhi Builders Llc | -- | Security Title Of Davis |
Source: Public Records
Mortgage History
| Date | Status | Borrower | Loan Amount |
|---|---|---|---|
| Previous Owner | Allen Christopher D | $286,900 | |
| Previous Owner | Cook Kimberley A | $234,602 |
Source: Public Records
Tax History
| Year | Tax Paid | Tax Assessment Tax Assessment Total Assessment is a certain percentage of the fair market value that is determined by local assessors to be the total taxable value of land and additions on the property. | Land | Improvement |
|---|---|---|---|---|
| 2025 | -- | $326,150 | $126,721 | $199,429 |
| 2024 | -- | $311,850 | $106,499 | $205,351 |
| 2023 | $676 | $545,000 | $148,296 | $396,704 |
| 2022 | $676 | $321,200 | $85,131 | $236,069 |
| 2021 | $32 | $456,000 | $125,999 | $330,001 |
| 2020 | $2,626 | $395,000 | $108,907 | $286,093 |
| 2019 | $2,626 | $377,000 | $107,494 | $269,506 |
| 2018 | $2,449 | $349,000 | $103,255 | $245,745 |
| 2016 | $866 | $158,510 | $39,593 | $118,917 |
| 2015 | $2,054 | $146,190 | $39,593 | $106,597 |
| 2014 | $354 | $149,766 | $39,593 | $110,173 |
| 2013 | -- | $99,132 | $27,500 | $71,632 |
Source: Public Records
Map
Nearby Homes
- 1876 W 2400 S
- 1826 W 2350 S
- 2104 W 2200 S
- 1686 W 2425 S
- 1705 W 2770 S
- 1653 W 2700 S Unit 218
- 1643 W 2700 S Unit 216
- 1667 W 2770 S Unit 206
- 2742 S Allison Way Unit 212
- 2653 S 2430 W Unit 115
- 2721 S Allison Way
- 2574 S 2430 W Unit 503
- 2594 S 2430 W Unit 501
- 2138 Craig Ln
- 2666 S 2430 W Unit 103
- 2811 S 2425 W
- 2968 Old Emigrant Rd
- 1996 S 1675 W
- 1694 2975 S Unit D
- 2077 S 1575 W
Your Personal Tour Guide
Ask me questions while you tour the home.