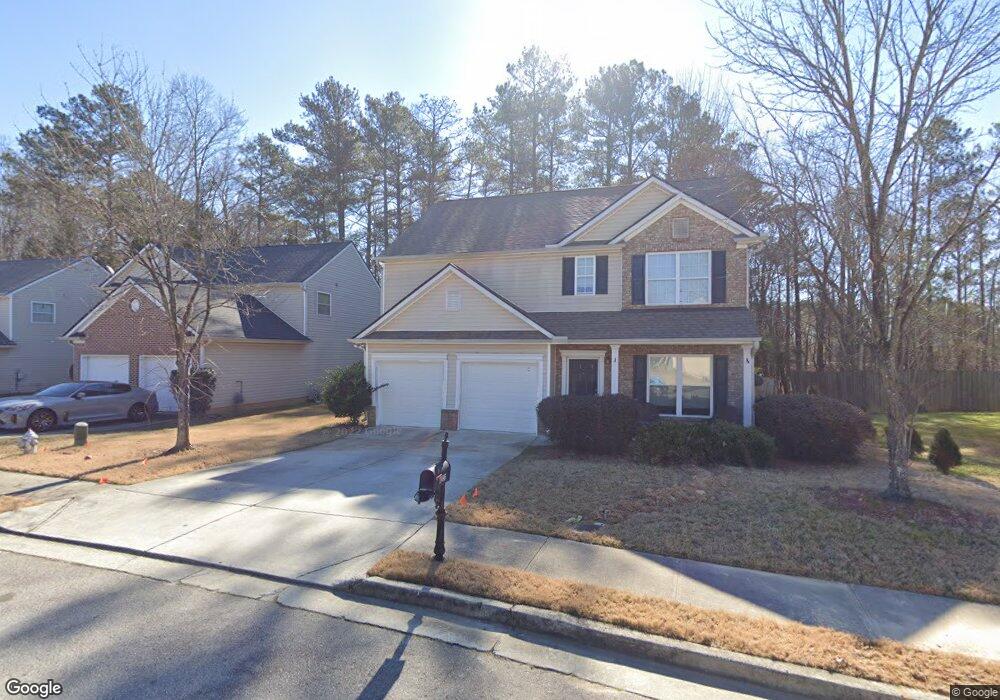
2496 Tullamore Cir Unit 23 Snellville, GA 30039
Estimated Value: $351,001 - $382,000
3
Beds
3
Baths
2,092
Sq Ft
$174/Sq Ft
Est. Value
About This Home
This home is located at 2496 Tullamore Cir Unit 23, Snellville, GA 30039 and is currently estimated at $363,000, approximately $173 per square foot. 2496 Tullamore Cir Unit 23 is a home located in Gwinnett County with nearby schools including Centerville Elementary School, Shiloh Middle School, and Shiloh High School.
Ownership History
Date
Name
Owned For
Owner Type
Purchase Details
Closed on
Sep 21, 2022
Sold by
Raheen Zainab
Bought by
Austin Allen and Austin Jessica Allen
Current Estimated Value
Home Financials for this Owner
Home Financials are based on the most recent Mortgage that was taken out on this home.
Original Mortgage
$338,318
Outstanding Balance
$326,413
Interest Rate
6.6%
Mortgage Type
FHA
Estimated Equity
$36,587
Purchase Details
Closed on
Feb 18, 2014
Sold by
Raheen Zainab
Bought by
Raheen Zainab and Hussain Ilsmatullah
Purchase Details
Closed on
Jun 24, 2004
Sold by
Bowen Family Homes Inc
Bought by
Valenzuela Luis and Valenzuela Angela
Home Financials for this Owner
Home Financials are based on the most recent Mortgage that was taken out on this home.
Original Mortgage
$144,942
Interest Rate
6.25%
Mortgage Type
VA
Create a Home Valuation Report for This Property
The Home Valuation Report is an in-depth analysis detailing your home's value as well as a comparison with similar homes in the area
Home Values in the Area
Average Home Value in this Area
Purchase History
| Date | Buyer | Sale Price | Title Company |
|---|---|---|---|
| Austin Allen | $350,000 | -- | |
| Raheen Zainab | $135,000 | -- | |
| Raheen Zainab | $135,000 | -- | |
| Valenzuela Luis | $147,300 | -- |
Source: Public Records
Mortgage History
| Date | Status | Borrower | Loan Amount |
|---|---|---|---|
| Open | Austin Allen | $338,318 | |
| Previous Owner | Valenzuela Luis | $144,942 |
Source: Public Records
Tax History Compared to Growth
Tax History
| Year | Tax Paid | Tax Assessment Tax Assessment Total Assessment is a certain percentage of the fair market value that is determined by local assessors to be the total taxable value of land and additions on the property. | Land | Improvement |
|---|---|---|---|---|
| 2024 | $4,610 | $126,360 | $30,000 | $96,360 |
| 2023 | $4,610 | $131,560 | $28,000 | $103,560 |
| 2022 | $0 | $124,120 | $25,200 | $98,920 |
| 2021 | $3,321 | $83,640 | $13,400 | $70,240 |
| 2020 | $3,339 | $83,640 | $13,400 | $70,240 |
| 2019 | $3,217 | $83,640 | $13,400 | $70,240 |
| 2018 | $2,762 | $70,640 | $12,000 | $58,640 |
| 2016 | $2,566 | $64,560 | $12,000 | $52,560 |
| 2015 | $2,220 | $54,000 | $9,680 | $44,320 |
| 2014 | $1,988 | $53,120 | $9,680 | $43,440 |
Source: Public Records
Map
Nearby Homes
- 2546 Tullamore Cir
- 2316 Tullamore Cir
- 3637 Chinaberry Ln
- 3045 Wildflower Ln
- 3430 Park Glenn Ln
- 3695 Winterberry Ln
- 3607 Rainbow Cir
- 2433 Idlewood Way
- 2895 Wildflower Ln
- 2315 Oakland Spring Dr
- 3681 Basswood Rd
- 3487 Desoto Rd
- 3738 Burnt Leaf Ln
- 2296 Thackery Rd
- 2325 Thackery Rd
- 2459 Jacks View Ct
- 3265 Brownwood Dr
- 3893 Tanglewood Rd
- 3574 Timberloch Trail
- 2654 Laurel View Dr
- 2496 Tullamore Cir
- 2486 Tullamore Cir
- 2506 Tullamore Cir
- 2476 Tullamore Cir
- 2489 Tullamore Cir
- 2516 Tullamore Cir
- 2466 Tullamore Cir
- 2526 Tullamore Cir
- 2539 Tullamore Cir
- 3715 Tullamore Ln
- 2536 Tullamore Cir
- 2549 Tullamore Cir
- 3705 Tullamore Ln
- 2446 Tullamore Cir
- 3725 Tullamore Ln Unit 9
- 3725 Tullamore Ln
- 2559 Tullamore Cir
- 3695 Tullamore Ln
- 2556 Tullamore Cir
- 3702 Tullamore Ln