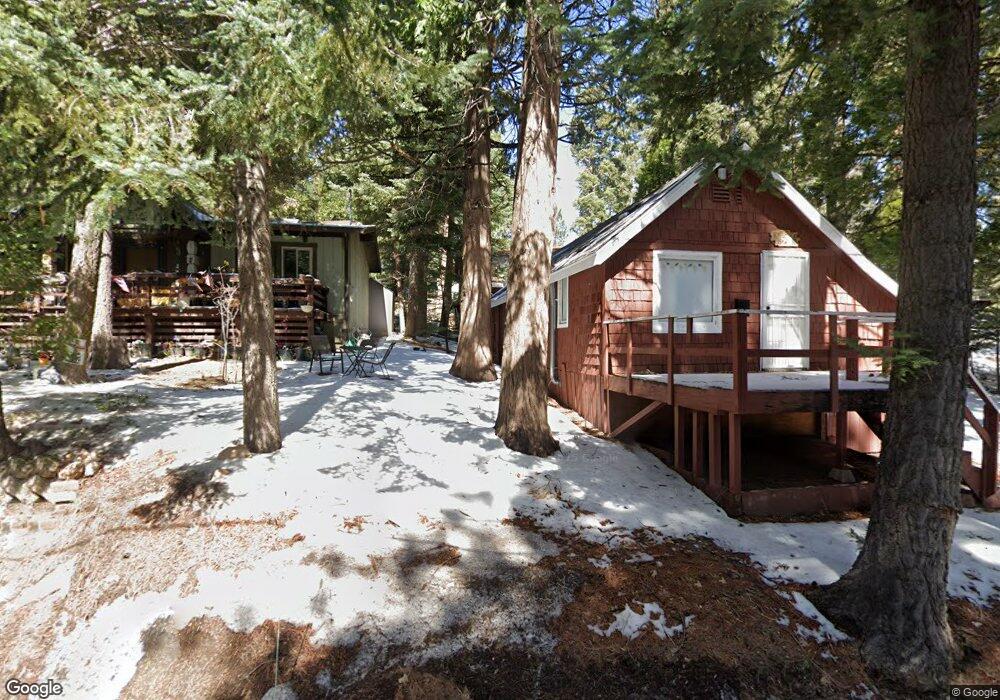
2498 Whispering Pines Dr Running Springs, CA 92382
Estimated Value: $189,344 - $305,000
1
Bed
1
Bath
546
Sq Ft
$442/Sq Ft
Est. Value
About This Home
This home is located at 2498 Whispering Pines Dr, Running Springs, CA 92382 and is currently estimated at $241,086, approximately $441 per square foot. 2498 Whispering Pines Dr is a home with nearby schools including Charles Hoffman Elementary School, Mary P. Henck Intermediate School, and Rim Of The World Senior High School.
Ownership History
Date
Name
Owned For
Owner Type
Purchase Details
Closed on
Sep 7, 2021
Sold by
Knecht Genevieve June and Knecht Family Trust
Bought by
Knecht Genevieve June and Knecht Family Trust
Current Estimated Value
Purchase Details
Closed on
Dec 19, 1994
Sold by
Knecht La Wayne and Knecht Genevieve June
Bought by
Knecht La Wayne Jacob and Knecht Genevieve June
Purchase Details
Closed on
Jun 30, 1994
Sold by
Nation R Douglas and Nation Darlene J
Bought by
Knecht La Wayne and Knecht Jenny
Home Financials for this Owner
Home Financials are based on the most recent Mortgage that was taken out on this home.
Original Mortgage
$35,000
Interest Rate
8.38%
Mortgage Type
Seller Take Back
Purchase Details
Closed on
Jul 9, 1993
Sold by
Vanderpol Dorothy B
Bought by
Vanderpol Dorothy B and The Dorothy B Vanderpol Trust
Create a Home Valuation Report for This Property
The Home Valuation Report is an in-depth analysis detailing your home's value as well as a comparison with similar homes in the area
Home Values in the Area
Average Home Value in this Area
Purchase History
| Date | Buyer | Sale Price | Title Company |
|---|---|---|---|
| Knecht Genevieve June | -- | None Available | |
| Knecht La Wayne Jacob | -- | -- | |
| Knecht La Wayne | $44,000 | First American Title Ins Co | |
| Vanderpol Dorothy B | -- | -- |
Source: Public Records
Mortgage History
| Date | Status | Borrower | Loan Amount |
|---|---|---|---|
| Closed | Knecht La Wayne | $35,000 |
Source: Public Records
Tax History Compared to Growth
Tax History
| Year | Tax Paid | Tax Assessment Tax Assessment Total Assessment is a certain percentage of the fair market value that is determined by local assessors to be the total taxable value of land and additions on the property. | Land | Improvement |
|---|---|---|---|---|
| 2025 | $1,139 | $73,909 | $31,912 | $41,997 |
| 2024 | $1,139 | $72,460 | $31,286 | $41,174 |
| 2023 | $1,129 | $71,040 | $30,673 | $40,367 |
| 2022 | $1,111 | $69,647 | $30,072 | $39,575 |
| 2021 | $1,102 | $68,281 | $29,482 | $38,799 |
| 2020 | $1,102 | $67,581 | $29,180 | $38,401 |
| 2019 | $1,080 | $66,256 | $28,608 | $37,648 |
| 2018 | $1,032 | $64,957 | $28,047 | $36,910 |
| 2017 | $1,018 | $63,683 | $27,497 | $36,186 |
| 2016 | $994 | $62,434 | $26,958 | $35,476 |
| 2015 | $986 | $61,496 | $26,553 | $34,943 |
| 2014 | $973 | $60,292 | $26,033 | $34,259 |
Source: Public Records
Map
Nearby Homes
- 2524 Spring Dr
- 2500 Spring Dr
- 2557 Whispering Pines Dr
- 2544 Spring Dr
- 2548 Secret Dr
- 31867 Wagon Wheel Dr
- 2405 Whispering Pines Dr
- 31816 Silver Spruce Dr
- 2493 Palo Alto Way
- 31805 Luring Pines Dr
- 2463 Palo Alto Way
- 2600 Whispering Pines Dr
- 0 California 18
- 45 Deep Creek Dr
- 000 Deep Creek Dr
- 00 Deep Creek Dr
- 2340 Deep Creek Dr
- 31766 Silver Spruce Dr
- 31771 Panorama Dr
- 2344 Deep Creek Dr
- 2502 Whispering Pines Dr
- 2489 Secret Dr
- 2493 Secret Dr
- 25 Whispering Pines Dr
- 2508 Whispering Pines Dr
- 0 Secret Dr Unit CRRW24175703
- 0 Secret Dr Unit RW281469
- 0 Secret Dr Unit RW2192030
- 0 Secret Dr Unit EV21037924
- 0 Secret Dr Unit 2300236
- 0 Secret Dr
- 2503 Whispering Pines Dr
- 2485 Secret Dr
- 2495 Whispering Pines Dr
- 2520 Whispering Pines Dr
- 2515 Whispering Pines Dr
- 2509 Secret Dr
- 2474 Secret Dr
- 2484 Secret Dr
- 2487 Whispering Pines Dr