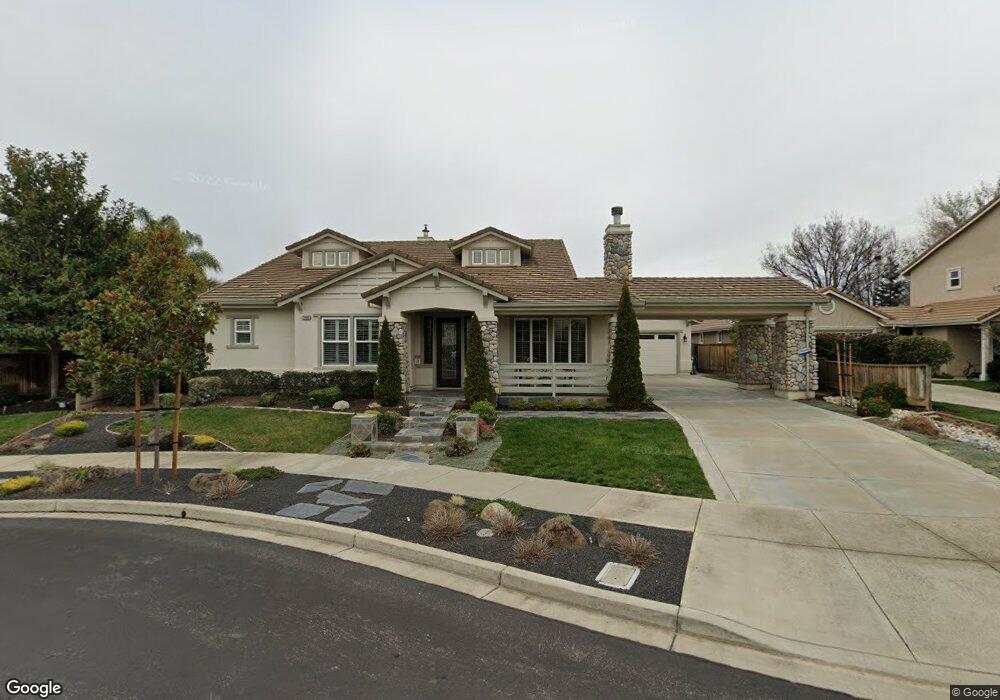
2499 Ancona Cir Livermore, CA 94550
Kristopher Ranch NeighborhoodEstimated Value: $1,945,000 - $2,350,000
4
Beds
4
Baths
2,905
Sq Ft
$758/Sq Ft
Est. Value
About This Home
This home is located at 2499 Ancona Cir, Livermore, CA 94550 and is currently estimated at $2,201,894, approximately $757 per square foot. 2499 Ancona Cir is a home located in Alameda County with nearby schools including Emma C. Smith Elementary School, William Mendenhall Middle School, and Granada High School.
Ownership History
Date
Name
Owned For
Owner Type
Purchase Details
Closed on
Oct 29, 2012
Sold by
Jones Gordon F and Jones Janice A
Bought by
Jones Gordon Francis and Jones Janice Ann
Current Estimated Value
Purchase Details
Closed on
Feb 25, 2011
Sold by
Graham Lyndon and Graham Cindy
Bought by
Jones Gordon F and Jones Janice A
Home Financials for this Owner
Home Financials are based on the most recent Mortgage that was taken out on this home.
Original Mortgage
$417,000
Outstanding Balance
$19,195
Interest Rate
4.75%
Mortgage Type
New Conventional
Estimated Equity
$2,182,699
Purchase Details
Closed on
Jul 19, 2002
Sold by
Shea Homes Ltd Partnership
Bought by
Graham Lyndon A and Graham Cindy F
Home Financials for this Owner
Home Financials are based on the most recent Mortgage that was taken out on this home.
Original Mortgage
$542,000
Interest Rate
5.62%
Create a Home Valuation Report for This Property
The Home Valuation Report is an in-depth analysis detailing your home's value as well as a comparison with similar homes in the area
Home Values in the Area
Average Home Value in this Area
Purchase History
| Date | Buyer | Sale Price | Title Company |
|---|---|---|---|
| Jones Gordon Francis | -- | None Available | |
| Jones Gordon F | $825,000 | Chicago Title Company | |
| Graham Lyndon A | $790,000 | First American Title Guarant |
Source: Public Records
Mortgage History
| Date | Status | Borrower | Loan Amount |
|---|---|---|---|
| Open | Jones Gordon F | $417,000 | |
| Previous Owner | Graham Lyndon A | $542,000 |
Source: Public Records
Tax History Compared to Growth
Tax History
| Year | Tax Paid | Tax Assessment Tax Assessment Total Assessment is a certain percentage of the fair market value that is determined by local assessors to be the total taxable value of land and additions on the property. | Land | Improvement |
|---|---|---|---|---|
| 2025 | $13,595 | $1,081,778 | $317,072 | $771,706 |
| 2024 | $13,595 | $1,060,437 | $310,857 | $756,580 |
| 2023 | $13,404 | $1,046,513 | $304,764 | $741,749 |
| 2022 | $13,212 | $1,018,997 | $298,789 | $727,208 |
| 2021 | $12,183 | $998,881 | $292,931 | $712,950 |
| 2020 | $12,526 | $995,571 | $289,928 | $705,643 |
| 2019 | $12,601 | $976,058 | $284,246 | $691,812 |
| 2018 | $12,345 | $956,928 | $278,675 | $678,253 |
| 2017 | $11,952 | $938,170 | $273,212 | $664,958 |
| 2016 | $11,538 | $919,779 | $267,856 | $651,923 |
| 2015 | $10,829 | $905,969 | $263,835 | $642,134 |
| 2014 | $10,648 | $888,223 | $258,667 | $629,556 |
Source: Public Records
Map
Nearby Homes
- 2597 Ancona Cir
- 1037 Lexington Way
- 1164 Lexington Way
- 2276 Stonebridge Rd
- 3080 Bresso Dr
- 578 Regulus Rd
- 1110 Lomitas Ave
- 2470 Sheffield Dr
- 791 Via Del Sol
- 355 E Vineyard Ave
- 2553 Regent Rd
- 2583 Regent Rd
- 1734 Catalina Ct
- 2858 Superior Dr
- 1348 Carlton Place
- 628 Lido Dr
- 967 Miranda Way
- 1484 Heidelberg Dr
- 578 Escondido Cir
- 2323 Grosvenor Heights Ct Unit C
- 2491 Ancona Cir
- 2507 Ancona Cir
- 2576 Orvieto Ct
- 2485 Ancona Cir
- 2543 Ancona Cir
- 2512 Orvieto Ct
- 2558 Ancona Cir
- 742 Trinity Hills Ln
- 2598 Orvieto Ct
- 750 Trinity Hills Ln
- 2473 Ancona Cir
- 2575 Ancona Cir
- 2480 Ancona Cir
- 2529 Orvieto Ct
- 2561 Orvieto Ct
- 2379 Bettona St
- 2387 Bettona St
- 2583 Orvieto Ct
- 774 Trinity Hills Ln
- 2371 Bettona St