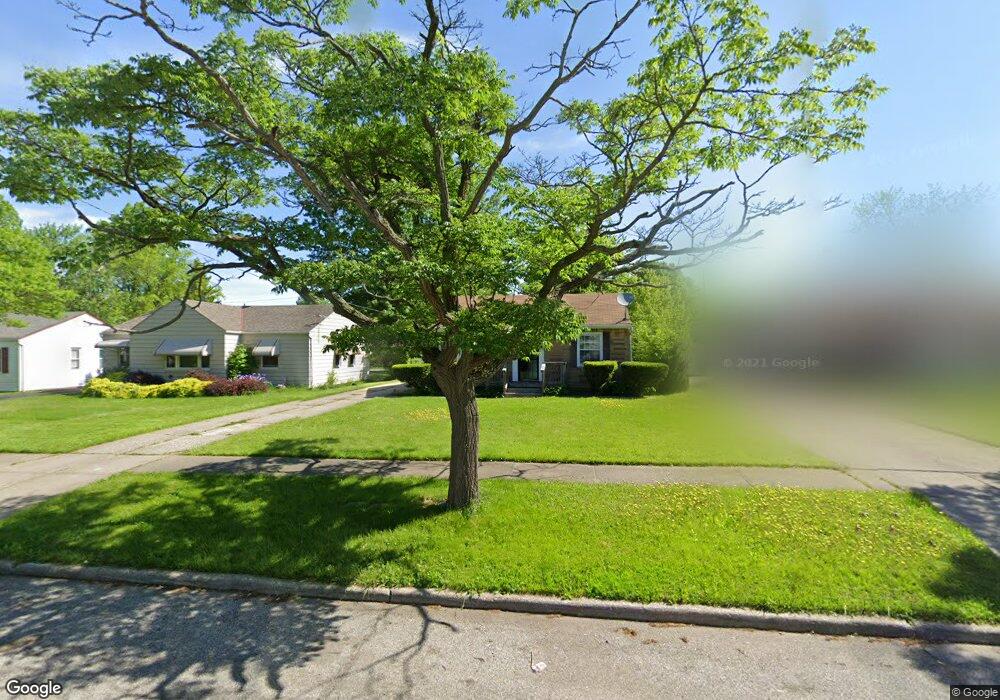
2499 Greenvale Rd Cleveland, OH 44121
Euclid-Green NeighborhoodEstimated Value: $67,371 - $120,000
2
Beds
1
Bath
754
Sq Ft
$126/Sq Ft
Est. Value
About This Home
This home is located at 2499 Greenvale Rd, Cleveland, OH 44121 and is currently estimated at $95,343, approximately $126 per square foot. 2499 Greenvale Rd is a home located in Cuyahoga County with nearby schools including Bolton, Adlai Stevenson School, and Anton Grdina School.
Ownership History
Date
Name
Owned For
Owner Type
Purchase Details
Closed on
Mar 25, 1999
Sold by
Washington Byron C
Bought by
Washington Cynthia D
Current Estimated Value
Purchase Details
Closed on
Dec 18, 1996
Sold by
Third Federal Savings &
Bought by
Washington Byron C and Washington Cynthia D
Home Financials for this Owner
Home Financials are based on the most recent Mortgage that was taken out on this home.
Original Mortgage
$36,000
Interest Rate
7.74%
Mortgage Type
New Conventional
Purchase Details
Closed on
May 6, 1996
Sold by
Sheriff Of Cuyahoga Coun
Bought by
Third Federal Savings & Loan Assoc
Purchase Details
Closed on
Jun 2, 1993
Sold by
Zak Ursula A
Bought by
Brooks Deborah
Purchase Details
Closed on
Mar 26, 1985
Sold by
Hobson Thomas E
Bought by
Zak Ursula A
Purchase Details
Closed on
Aug 8, 1979
Sold by
Tracy John J and Tracy Ann
Bought by
Hobson Thomas E
Purchase Details
Closed on
Jan 1, 1975
Bought by
Tracy John J and Tracy Ann
Create a Home Valuation Report for This Property
The Home Valuation Report is an in-depth analysis detailing your home's value as well as a comparison with similar homes in the area
Home Values in the Area
Average Home Value in this Area
Purchase History
| Date | Buyer | Sale Price | Title Company |
|---|---|---|---|
| Washington Cynthia D | -- | -- | |
| Washington Byron C | $40,000 | -- | |
| Third Federal Savings & Loan Assoc | $33,000 | -- | |
| Brooks Deborah | $45,000 | -- | |
| Zak Ursula A | $37,000 | -- | |
| Hobson Thomas E | $33,100 | -- | |
| Tracy John J | -- | -- |
Source: Public Records
Mortgage History
| Date | Status | Borrower | Loan Amount |
|---|---|---|---|
| Closed | Washington Byron C | $36,000 |
Source: Public Records
Tax History Compared to Growth
Tax History
| Year | Tax Paid | Tax Assessment Tax Assessment Total Assessment is a certain percentage of the fair market value that is determined by local assessors to be the total taxable value of land and additions on the property. | Land | Improvement |
|---|---|---|---|---|
| 2024 | $1,182 | $18,025 | $5,075 | $12,950 |
| 2023 | $759 | $10,010 | $3,080 | $6,930 |
| 2022 | $755 | $10,010 | $3,080 | $6,930 |
| 2021 | $747 | $10,010 | $3,080 | $6,930 |
| 2020 | $720 | $8,330 | $2,560 | $5,780 |
| 2019 | $666 | $23,800 | $7,300 | $16,500 |
| 2018 | $671 | $8,330 | $2,560 | $5,780 |
| 2017 | $684 | $8,300 | $2,030 | $6,270 |
| 2016 | $679 | $8,300 | $2,030 | $6,270 |
| 2015 | $701 | $8,300 | $2,030 | $6,270 |
| 2014 | $701 | $8,540 | $2,100 | $6,440 |
Source: Public Records
Map
Nearby Homes
- 2536 Greenvale Rd
- 2545 Greenvale Rd
- 2110 Miami Rd
- 3803 Bridgeview Dr
- 4031 Suffolk Rd
- 2017 Natona Rd
- 18132 Weston Rd
- 3927 Princeton Blvd
- 693 Quilliams Rd
- 3595 Runnymede Blvd
- 3811 Salisbury Rd
- 3867 Covington Rd
- 772 Quilliams Rd
- 4188 Glenridge Rd
- 3655 Langton Rd
- 237 Greenbriar Ct Unit F237
- 1897 Torbenson Dr
- 3609 Langton Rd
- 854 Keystone Dr
- 855 Roanoke Rd
- 2501 Greenvale Rd
- 2495 Greenvale Rd
- 2491 Greenvale Rd
- 2505 Greenvale Rd
- 2234 Green Rd
- 2240 Green Rd
- 2487 Greenvale Rd
- 2509 Greenvale Rd
- 2244 Green Rd
- 2230 Green Rd
- 2250 Green Rd
- 2224 Green Rd
- 2513 Greenvale Rd
- 2483 Greenvale Rd
- 2496 Greenvale Rd
- 2500 Greenvale Rd
- 2254 Green Rd
- 2492 Greenvale Rd
- 2220 Green Rd
- 2504 Greenvale Rd