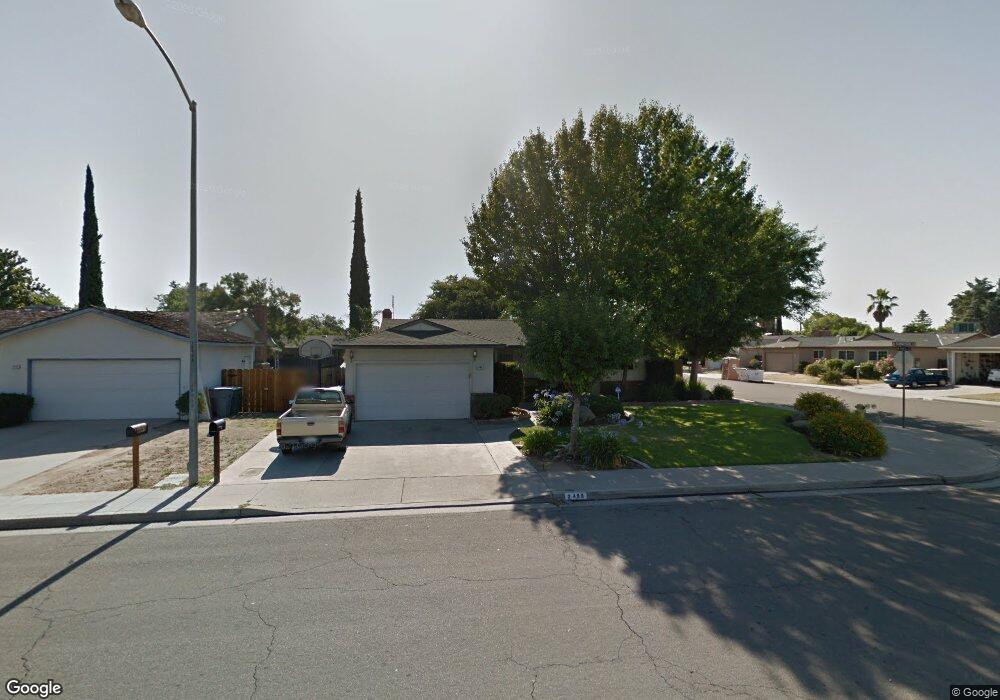
2499 Sunnyside Ave Clovis, CA 93611
Estimated Value: $366,837 - $402,000
3
Beds
2
Baths
1,271
Sq Ft
$305/Sq Ft
Est. Value
About This Home
This home is located at 2499 Sunnyside Ave, Clovis, CA 93611 and is currently estimated at $387,279, approximately $304 per square foot. 2499 Sunnyside Ave is a home located in Fresno County with nearby schools including Jefferson Elementary School, Clark Intermediate School, and Clovis High School.
Ownership History
Date
Name
Owned For
Owner Type
Purchase Details
Closed on
Jul 17, 2015
Sold by
Hoisington Jerry and Hoisington Linda
Bought by
The Jerry B Hoisington & Linda M Hoising and Hoisington Linda M
Current Estimated Value
Home Financials for this Owner
Home Financials are based on the most recent Mortgage that was taken out on this home.
Original Mortgage
$115,000
Outstanding Balance
$90,045
Interest Rate
3.98%
Mortgage Type
New Conventional
Estimated Equity
$297,234
Purchase Details
Closed on
Feb 1, 2010
Sold by
Hoisington Jerry B and Hoisington Linda M
Bought by
Hoisington Jerry B and Hoisington Linda M
Purchase Details
Closed on
Nov 13, 1995
Sold by
Va
Bought by
Hoisington Jerry B and Hoisington Linda M
Home Financials for this Owner
Home Financials are based on the most recent Mortgage that was taken out on this home.
Original Mortgage
$61,950
Interest Rate
7.47%
Create a Home Valuation Report for This Property
The Home Valuation Report is an in-depth analysis detailing your home's value as well as a comparison with similar homes in the area
Home Values in the Area
Average Home Value in this Area
Purchase History
| Date | Buyer | Sale Price | Title Company |
|---|---|---|---|
| The Jerry B Hoisington & Linda M Hoising | -- | First American Title Company | |
| Hoisington Jerry | -- | First American Title Company | |
| Hoisington Jerry B | -- | None Available | |
| Hoisington Jerry B | -- | Commerce Land Title |
Source: Public Records
Mortgage History
| Date | Status | Borrower | Loan Amount |
|---|---|---|---|
| Open | Hoisington Jerry | $115,000 | |
| Closed | Hoisington Jerry B | $61,950 |
Source: Public Records
Tax History
| Year | Tax Paid | Tax Assessment Tax Assessment Total Assessment is a certain percentage of the fair market value that is determined by local assessors to be the total taxable value of land and additions on the property. | Land | Improvement |
|---|---|---|---|---|
| 2025 | $1,591 | $133,588 | $51,775 | $81,813 |
| 2023 | $1,531 | $128,402 | $49,765 | $78,637 |
| 2022 | $1,511 | $125,886 | $48,790 | $77,096 |
| 2021 | $1,469 | $123,419 | $47,834 | $75,585 |
| 2020 | $1,463 | $122,154 | $47,344 | $74,810 |
| 2019 | $1,435 | $119,760 | $46,416 | $73,344 |
| 2018 | $1,404 | $117,412 | $45,506 | $71,906 |
| 2017 | $1,380 | $115,111 | $44,614 | $70,497 |
| 2016 | $1,334 | $112,855 | $43,740 | $69,115 |
| 2015 | $1,314 | $111,160 | $43,083 | $68,077 |
| 2014 | $1,290 | $108,984 | $42,240 | $66,744 |
Source: Public Records
Map
Nearby Homes
- 1488 Alamos Ave
- 1286 Piazza Ln
- 2523 Legacy Dr
- 1555 Pico Ave
- 2627 Stanford Ave
- 2306 Stanford Ave
- 2566 Mustang Dr
- 2214 Fordham Ave
- 1608 Gettysburg Ave
- 2916 Miami Ave
- 2612 Renn Ave
- 1707 Gettysburg Ave
- 1715 Donner Ave
- 2645 Fowler Ave
- 1721 Holland Ave
- 1515 Keats Ave
- 3099 Ezie Ave
- 3110 Ezie Ave
- 2468 Laverne Ave
- 3497 Shaw Ave
- 2469 Sunnyside Ave
- 2490 Miami Ave
- 2460 Miami Ave
- 2429 Sunnyside Ave
- 1402 Rall Ave
- 1412 Rall Ave
- 1391 Rall Ave
- 2440 Miami Ave
- 1422 Rall Ave
- 1380 Santa Ana Ave
- 1382 Rall Ave
- 1381 Rall Ave
- 2399 Sunnyside Ave
- 2529 Sunnyside Ave
- 1432 Rall Ave
- 2420 Miami Ave
- 1441 Rall Ave
- 1360 Santa Ana Ave
- 1372 Rall Ave
- 1440 Santa Ana Ave
Your Personal Tour Guide
Ask me questions while you tour the home.