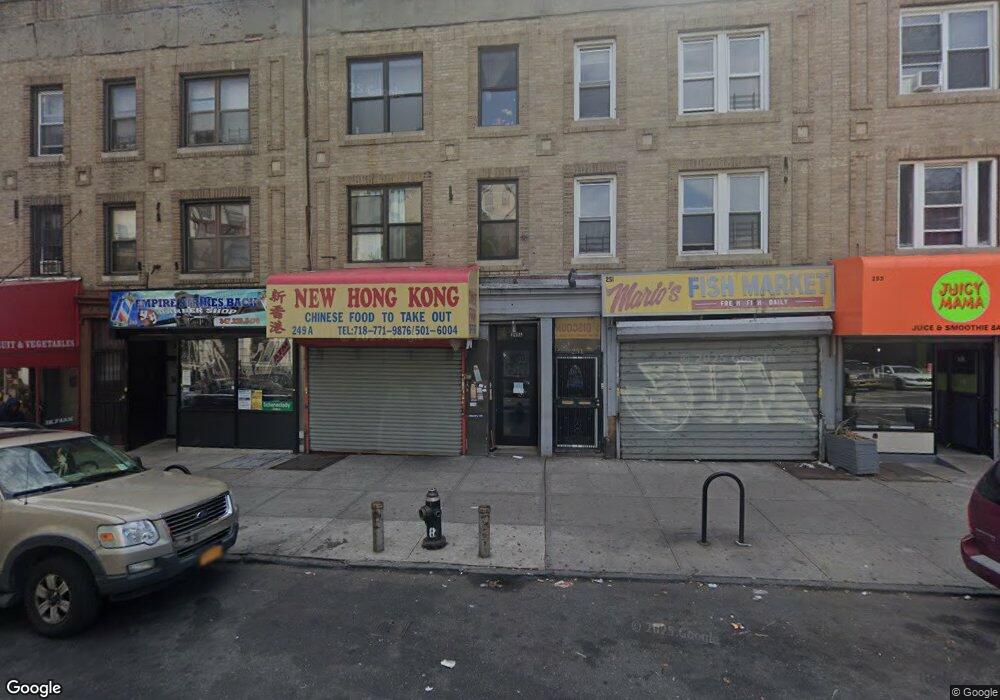
249A Schenectady Ave Unit 2 New York, NY 11213
Crown Heights NeighborhoodEstimated Value: $651,735
--
Bed
1
Bath
3,135
Sq Ft
$208/Sq Ft
Est. Value
About This Home
This home is located at 249A Schenectady Ave Unit 2, New York, NY 11213 and is currently estimated at $651,735, approximately $207 per square foot. 249A Schenectady Ave Unit 2 is a home located in Kings County with nearby schools including New Bridges Elementary School, Brooklyn Ascend Charter School, and Success Academy Charter School-NYC 9.
Ownership History
Date
Name
Owned For
Owner Type
Purchase Details
Closed on
Jul 14, 2011
Sold by
Warden Cecil and Warden Winsome
Bought by
249A Schenectady Avenue Llc
Current Estimated Value
Home Financials for this Owner
Home Financials are based on the most recent Mortgage that was taken out on this home.
Original Mortgage
$241,500
Outstanding Balance
$167,005
Interest Rate
4.62%
Mortgage Type
Commercial
Estimated Equity
$484,730
Purchase Details
Closed on
Jun 20, 1996
Sold by
Aruba Trading Corp
Bought by
Small Parkinson T and Small Arlene
Home Financials for this Owner
Home Financials are based on the most recent Mortgage that was taken out on this home.
Original Mortgage
$110,000
Interest Rate
9%
Mortgage Type
Seller Take Back
Create a Home Valuation Report for This Property
The Home Valuation Report is an in-depth analysis detailing your home's value as well as a comparison with similar homes in the area
Home Values in the Area
Average Home Value in this Area
Purchase History
| Date | Buyer | Sale Price | Title Company |
|---|---|---|---|
| 249A Schenectady Avenue Llc | $345,000 | -- | |
| 249A Schenectady Avenue Llc | $345,000 | -- | |
| Small Parkinson T | $120,000 | -- | |
| Small Parkinson T | $120,000 | -- |
Source: Public Records
Mortgage History
| Date | Status | Borrower | Loan Amount |
|---|---|---|---|
| Open | 249A Schenectady Avenue Llc | $241,500 | |
| Closed | 249A Schenectady Avenue Llc | $241,500 | |
| Previous Owner | Small Parkinson T | $110,000 |
Source: Public Records
Tax History Compared to Growth
Tax History
| Year | Tax Paid | Tax Assessment Tax Assessment Total Assessment is a certain percentage of the fair market value that is determined by local assessors to be the total taxable value of land and additions on the property. | Land | Improvement |
|---|---|---|---|---|
| 2025 | $7,143 | $65,580 | $18,060 | $47,520 |
| 2024 | $7,143 | $66,180 | $18,060 | $48,120 |
| 2023 | $6,906 | $58,500 | $18,060 | $40,440 |
| 2022 | $6,494 | $65,880 | $18,060 | $47,820 |
| 2021 | $6,554 | $59,400 | $18,060 | $41,340 |
| 2020 | $3,258 | $51,360 | $18,060 | $33,300 |
| 2019 | $6,200 | $44,640 | $18,060 | $26,580 |
| 2018 | $5,776 | $28,336 | $13,757 | $14,579 |
| 2017 | $5,526 | $27,110 | $14,118 | $12,992 |
| 2016 | $5,188 | $25,952 | $13,585 | $12,367 |
| 2015 | $2,329 | $25,952 | $11,538 | $14,414 |
| 2014 | $2,329 | $19,159 | $8,870 | $10,289 |
Source: Public Records
Map
Nearby Homes
- 1337 Sterling Place
- 1298 Sterling Place
- 1411 Sterling Place
- 1745 Union St
- 1284 Sterling Place
- 1145 Eastern Pkwy
- 1254 Park Place Unit 3
- 1777 Union St
- 1490 St Johns Place
- 176 Utica Ave
- 1248 Prospect Place
- 1437 Lincoln Place
- 1423 Park Place
- 147 Schenectady Ave
- 141 Schenectady Ave
- 1208 Sterling Place
- 1536 Union St
- 294 Albany Ave
- 1710 Carroll St Unit D5
- 234 Albany Ave
- 249 Schenectady Ave Unit 2
- 249 Schenectady Ave
- 249A Schenectady Ave
- 251 Schenectady Ave
- 251 Schenectady Ave Unit 3
- 247 Schenectady Ave
- 253 Schenectady Ave
- 1299 Lincoln Place Unit 3R
- 1299 Lincoln Place Unit 6
- 1299 Lincoln Place Unit 4
- 1299 Lincoln Place Unit 1D
- 1299 Lincoln Place Unit 5
- 1301 Lincoln Place
- 243 Schenectady Ave
- 1305 Lincoln Place
- 255 Schenectady Ave
- 1309 Lincoln Place Unit Building
- 1309 Lincoln Place
- 1309 Lincoln Place Unit 4R
- 1309 Lincoln Place Unit 4L