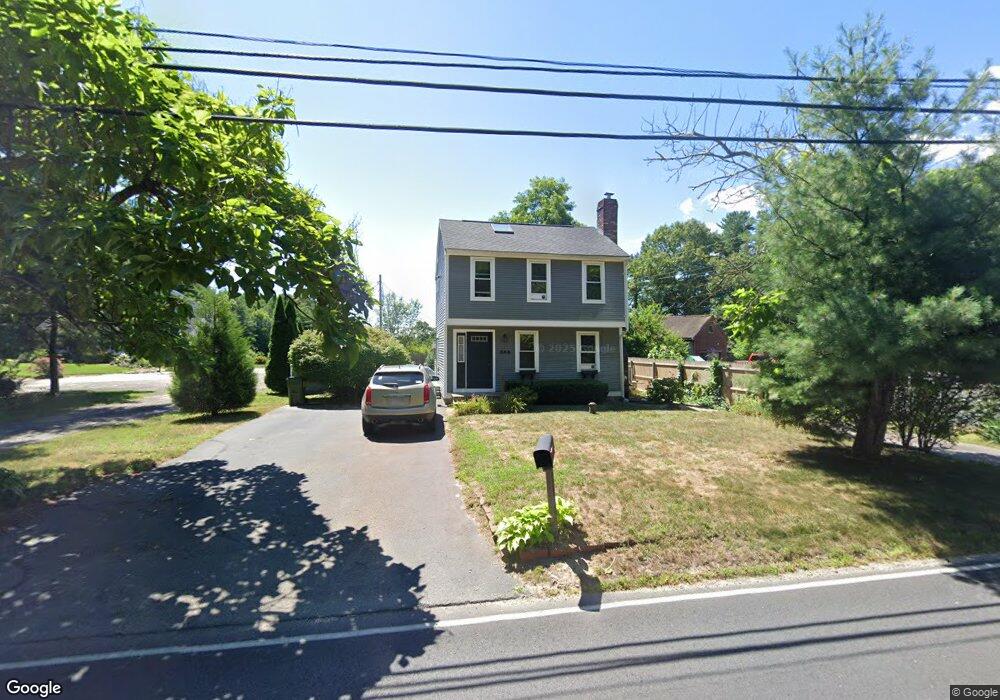
24A Rochester Rd Carver, MA 02330
Estimated Value: $433,299 - $525,000
2
Beds
2
Baths
1,200
Sq Ft
$393/Sq Ft
Est. Value
About This Home
This home is located at 24A Rochester Rd, Carver, MA 02330 and is currently estimated at $471,575, approximately $392 per square foot. 24A Rochester Rd is a home located in Plymouth County with nearby schools including Carver Elementary School and Carver Middle/High School.
Ownership History
Date
Name
Owned For
Owner Type
Purchase Details
Closed on
Aug 31, 2017
Sold by
Kotkowski Stefan E
Bought by
Cassetta Joseph M
Current Estimated Value
Home Financials for this Owner
Home Financials are based on the most recent Mortgage that was taken out on this home.
Original Mortgage
$260,000
Outstanding Balance
$217,468
Interest Rate
3.96%
Mortgage Type
VA
Estimated Equity
$254,107
Purchase Details
Closed on
Jul 31, 2003
Sold by
Zacchini Eric A
Bought by
Kotkowski Stefan E
Home Financials for this Owner
Home Financials are based on the most recent Mortgage that was taken out on this home.
Original Mortgage
$212,400
Interest Rate
5.28%
Mortgage Type
Purchase Money Mortgage
Purchase Details
Closed on
Mar 5, 1999
Sold by
Gonsalves Deborah L
Bought by
Zacchini Eric A
Purchase Details
Closed on
Jun 16, 1998
Sold by
J Gosselin Constr Co I
Bought by
Shores Roger W and Shores Lois A
Create a Home Valuation Report for This Property
The Home Valuation Report is an in-depth analysis detailing your home's value as well as a comparison with similar homes in the area
Home Values in the Area
Average Home Value in this Area
Purchase History
| Date | Buyer | Sale Price | Title Company |
|---|---|---|---|
| Cassetta Joseph M | $260,000 | -- | |
| Kotkowski Stefan E | $236,000 | -- | |
| Zacchini Eric A | $110,000 | -- | |
| Shores Roger W | $169,800 | -- |
Source: Public Records
Mortgage History
| Date | Status | Borrower | Loan Amount |
|---|---|---|---|
| Open | Cassetta Joseph M | $260,000 | |
| Previous Owner | Shores Roger W | $121,000 | |
| Previous Owner | Shores Roger W | $212,400 |
Source: Public Records
Tax History Compared to Growth
Tax History
| Year | Tax Paid | Tax Assessment Tax Assessment Total Assessment is a certain percentage of the fair market value that is determined by local assessors to be the total taxable value of land and additions on the property. | Land | Improvement |
|---|---|---|---|---|
| 2025 | $4,954 | $357,200 | $86,600 | $270,600 |
| 2024 | $4,716 | $332,800 | $89,200 | $243,600 |
| 2023 | $4,573 | $313,400 | $89,200 | $224,200 |
| 2022 | $4,323 | $270,500 | $76,200 | $194,300 |
| 2021 | $4,166 | $245,900 | $68,100 | $177,800 |
| 2020 | $3,973 | $231,100 | $63,600 | $167,500 |
| 2019 | $3,870 | $227,000 | $61,800 | $165,200 |
| 2018 | $3,679 | $208,700 | $61,800 | $146,900 |
| 2017 | $3,554 | $200,900 | $59,400 | $141,500 |
| 2016 | $3,275 | $192,300 | $56,600 | $135,700 |
| 2015 | $3,205 | $188,400 | $56,600 | $131,800 |
| 2014 | $3,091 | $181,700 | $71,500 | $110,200 |
Source: Public Records
Map
Nearby Homes
- 24 Rochester Rd
- 28 Rochester Rd
- 26 Rochester Rd
- 27 Rochester Rd
- 29 Rochester Rd
- 22 Rochester Rd
- 31 Rochester Rd
- 20 Rochester Rd
- 19 Rochester Rd
- 1 Eda Ave
- 34 Rochester Rd
- 18 Rochester Rd
- 18R Rochester Rd
- 33 Rochester Rd
- 16 Rochester Rd
- 38 Rochester Rd
- 35 Rochester Rd
- 40 Rochester Rd
- 0 Pine St Rochester Rd Unit 72593135
- 42 Rochester Rd