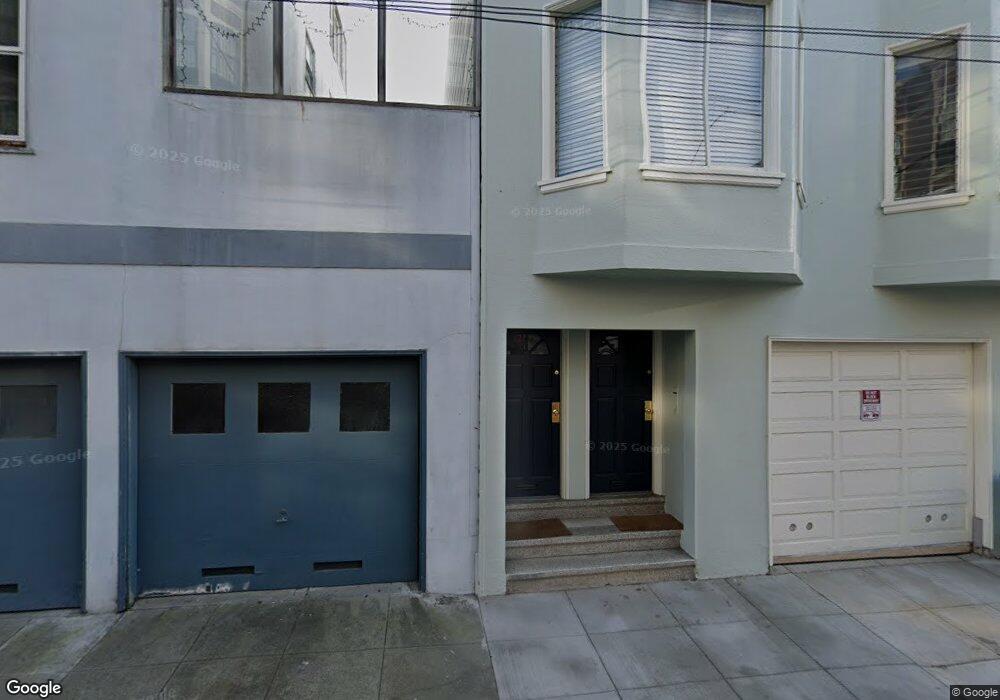
25-27 Moulton St San Francisco, CA 94123
Cow Hollow NeighborhoodEstimated Value: $1,917,000 - $2,989,096
4
Beds
2
Baths
2,360
Sq Ft
$1,088/Sq Ft
Est. Value
About This Home
This home is located at 25-27 Moulton St, San Francisco, CA 94123 and is currently estimated at $2,568,524, approximately $1,088 per square foot. 25-27 Moulton St is a home located in San Francisco County with nearby schools including Sherman Elementary, Marina Middle School, and Mary L. Booker Leadership Academy.
Ownership History
Date
Name
Owned For
Owner Type
Purchase Details
Closed on
Jan 17, 2023
Sold by
Brossman William F and Brossman Euna
Bought by
Goldeneye Trust and Golden City Trust
Current Estimated Value
Home Financials for this Owner
Home Financials are based on the most recent Mortgage that was taken out on this home.
Original Mortgage
$1,326,500
Outstanding Balance
$1,266,788
Interest Rate
4.65%
Mortgage Type
New Conventional
Estimated Equity
$1,301,736
Purchase Details
Closed on
Dec 22, 1997
Sold by
Pisoni Michael A and Pisoni Patricia M
Bought by
Steiner Monika D
Home Financials for this Owner
Home Financials are based on the most recent Mortgage that was taken out on this home.
Original Mortgage
$400,000
Interest Rate
4.95%
Mortgage Type
Commercial
Purchase Details
Closed on
Jan 5, 1997
Sold by
Pisoni Michael A and Pisoni Patricia M
Bought by
Pisoni Michael A and Pisoni Patricia M
Create a Home Valuation Report for This Property
The Home Valuation Report is an in-depth analysis detailing your home's value as well as a comparison with similar homes in the area
Home Values in the Area
Average Home Value in this Area
Purchase History
| Date | Buyer | Sale Price | Title Company |
|---|---|---|---|
| Goldeneye Trust | $1,895,000 | Fidelity National Title | |
| Steiner Monika D | $400,000 | Fidelity National Title Co | |
| Pisoni Michael A | $177,500 | -- |
Source: Public Records
Mortgage History
| Date | Status | Borrower | Loan Amount |
|---|---|---|---|
| Open | Goldeneye Trust | $1,326,500 | |
| Previous Owner | Steiner Monika D | $400,000 |
Source: Public Records
Tax History Compared to Growth
Tax History
| Year | Tax Paid | Tax Assessment Tax Assessment Total Assessment is a certain percentage of the fair market value that is determined by local assessors to be the total taxable value of land and additions on the property. | Land | Improvement |
|---|---|---|---|---|
| 2025 | $23,432 | $1,971,556 | $1,380,090 | $591,466 |
| 2024 | $23,432 | $1,932,900 | $1,353,030 | $579,870 |
| 2023 | $27,272 | $2,257,667 | $1,580,367 | $677,300 |
| 2022 | $26,762 | $2,213,400 | $1,549,380 | $664,020 |
| 2021 | $7,827 | $601,527 | $300,604 | $300,923 |
| 2020 | $9,589 | $730,024 | $365,012 | $365,012 |
| 2019 | $9,267 | $715,710 | $357,855 | $357,855 |
| 2018 | $8,949 | $701,676 | $350,838 | $350,838 |
| 2017 | $8,546 | $687,918 | $343,959 | $343,959 |
| 2016 | $8,385 | $674,430 | $337,215 | $337,215 |
| 2015 | $8,275 | $664,300 | $332,150 | $332,150 |
| 2014 | $8,193 | $651,288 | $325,644 | $325,644 |
Source: Public Records
Map
Nearby Homes
- 115 Magnolia St
- 3110 Buchanan St
- 1864 Greenwich St
- 32 Harris Place Unit A
- 2100 Green St Unit 206
- 1734 Bay St Unit 106
- 3537-3539 Fillmore St
- 1500 Francisco St Unit 1
- 1630 Lombard St
- 2160 Vallejo St
- 1468 Francisco St Unit 1
- 1755 Filbert St Unit 1
- 3208 Pierce St Unit 406
- 2916 Gough St
- 1776 Green St Unit 201
- 1671 Greenwich St
- 3675 Fillmore St Unit 302
- 2040 Broadway St Unit 102
- 2190 Broadway St Unit 1W
- 2755 Fillmore St
- 33 Moulton St
- 31 Moulton St
- 37 Moulton St Unit 1
- 25 Moulton St
- 2040 Greenwich St
- 2030 Greenwich St
- 2032 Greenwich St
- 2034 Greenwich St
- 2024 Greenwich St
- 2016 Greenwich St Unit 2018
- 49 Moulton St
- 2046 Greenwich St Unit 2
- 2046 Greenwich St Unit 1
- 2046 Greenwich St Unit 3
- 2010 Greenwich St Unit 2012
- 55 Moulton St
- 2052 Greenwich St
- 1929 Lombard St
- 44 Moulton St
- 63 Moulton St