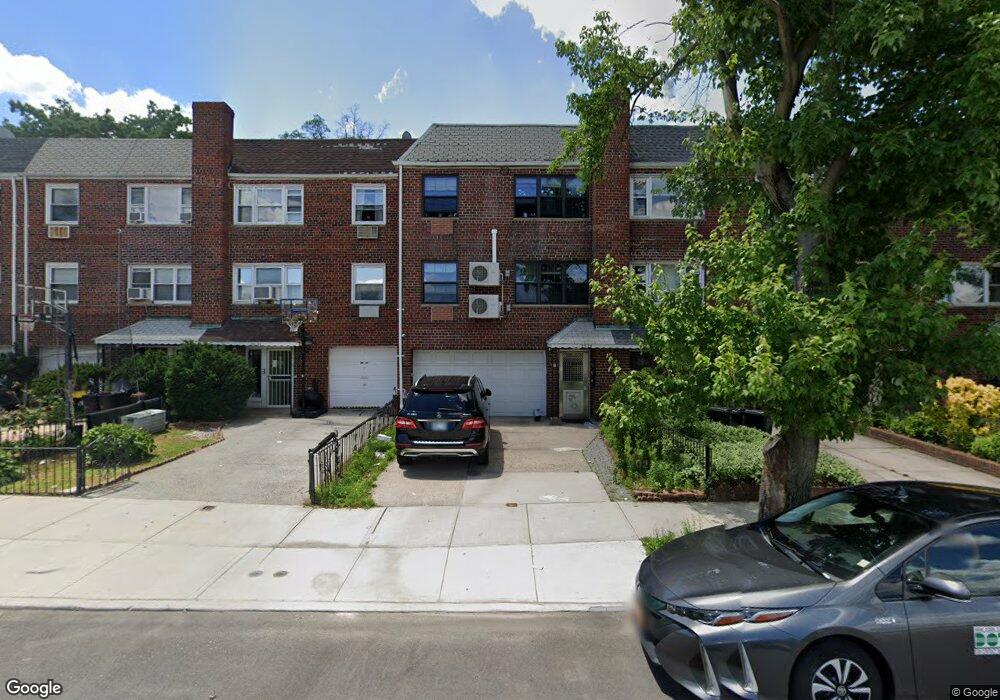
25-28 Parsons Blvd Unit 2Fl Flushing, NY 11354
Flushing NeighborhoodEstimated Value: $1,502,000 - $2,034,553
2
Beds
1
Bath
1,100
Sq Ft
$1,591/Sq Ft
Est. Value
About This Home
This home is located at 25-28 Parsons Blvd Unit 2Fl, Flushing, NY 11354 and is currently estimated at $1,750,138, approximately $1,591 per square foot. 25-28 Parsons Blvd Unit 2Fl is a home located in Queens County with nearby schools including P.S. 21 Edward Hart, Flushing High School, and St. Mel’s Catholic Academy.
Ownership History
Date
Name
Owned For
Owner Type
Purchase Details
Closed on
Mar 1, 2024
Sold by
Jiang Jing Guang and Ni Yayun
Bought by
Ni. Yayun
Current Estimated Value
Purchase Details
Closed on
Jul 25, 2022
Sold by
Jiang Jing Guang and Ni Ya Yun
Bought by
Jiang Jing Guang and Ni Yayun
Home Financials for this Owner
Home Financials are based on the most recent Mortgage that was taken out on this home.
Original Mortgage
$29,922
Outstanding Balance
$28,574
Interest Rate
5.7%
Mortgage Type
Purchase Money Mortgage
Estimated Equity
$1,721,564
Purchase Details
Closed on
May 3, 2018
Sold by
Lioudakis Michael and Lioudakis Panagiota
Bought by
Jiang Jing Guang and Ni Ya Yun
Home Financials for this Owner
Home Financials are based on the most recent Mortgage that was taken out on this home.
Original Mortgage
$975,000
Outstanding Balance
$836,681
Interest Rate
4.44%
Mortgage Type
Purchase Money Mortgage
Estimated Equity
$913,457
Create a Home Valuation Report for This Property
The Home Valuation Report is an in-depth analysis detailing your home's value as well as a comparison with similar homes in the area
Home Values in the Area
Average Home Value in this Area
Purchase History
| Date | Buyer | Sale Price | Title Company |
|---|---|---|---|
| Ni. Yayun | -- | -- | |
| Ni. Yayun | -- | -- | |
| Jiang Jing Guang | -- | -- | |
| Jiang Jing Guang | -- | -- | |
| Jiang Jing Guang | $1,625,000 | -- | |
| Jiang Jing Guang | $1,625,000 | -- |
Source: Public Records
Mortgage History
| Date | Status | Borrower | Loan Amount |
|---|---|---|---|
| Open | Jiang Jing Guang | $29,922 | |
| Closed | Jiang Jing Guang | $29,922 | |
| Open | Jiang Jing Guang | $975,000 | |
| Closed | Jiang Jing Guang | $975,000 |
Source: Public Records
Tax History Compared to Growth
Tax History
| Year | Tax Paid | Tax Assessment Tax Assessment Total Assessment is a certain percentage of the fair market value that is determined by local assessors to be the total taxable value of land and additions on the property. | Land | Improvement |
|---|---|---|---|---|
| 2025 | $13,010 | $68,087 | $18,796 | $49,291 |
| 2024 | $13,010 | $64,773 | $17,719 | $47,054 |
| 2023 | $12,381 | $61,644 | $14,389 | $47,255 |
| 2022 | $12,227 | $78,660 | $19,860 | $58,800 |
| 2021 | $12,827 | $74,340 | $19,860 | $54,480 |
| 2020 | $10,793 | $67,920 | $19,860 | $48,060 |
| 2019 | $10,089 | $58,440 | $19,860 | $38,580 |
| 2018 | $9,300 | $45,621 | $13,592 | $32,029 |
| 2017 | $9,232 | $45,290 | $15,158 | $30,132 |
| 2016 | $9,004 | $45,290 | $15,158 | $30,132 |
| 2015 | $5,153 | $42,492 | $18,077 | $24,415 |
| 2014 | $5,153 | $40,190 | $20,513 | $19,677 |
Source: Public Records
Map
Nearby Homes
- 25-11 Union St Unit 2G
- 25-11 Union St Unit 2A
- 142-15 26th Ave Unit 4D
- 14215 26th Ave Unit 5F
- 142-21 26th Ave Unit 4F
- 142-21 26th Ave Unit 6E
- 142-21 26th Ave Unit 1D
- 142-21 26th Ave Unit 1A
- 25-12 Union St Unit 3B
- 2518 Union St Unit 5A
- 25-18 Union St Unit 4G
- 14425 26th Ave
- 145-17 Willets Point Blvd
- 14445 25th Dr
- 23-38 144th St
- 25-34 Union St Unit 5E
- 25-40 Union St Unit 1G
- 25-40 Union St Unit 3F
- 27-04 Parsons Blvd Unit 2
- 27-04 Parsons Blvd Unit 6
- 25-28 Parsons Blvd Unit 2 F
- 25-28 Parsons Blvd
- 25-28 Parsons Blvd Unit 2Fl3Fl
- 2528 Parsons Blvd
- 2530 Parsons Blvd
- 2530 Parsons Blvd
- 2530 Parsons Blvd Unit 2
- 2526 Parsons Blvd
- 2526 Parsons Blvd Unit 1st Fl
- 2526 Parsons Blvd Unit 1 + B
- 25-26 Parsons Blvd Unit 3
- 25-26 Parsons Blvd Unit 3Fl
- 25-26 Parsons Blvd Unit 1Fl+Bm
- 25-26 Parsons Blvd Unit 1st Fl
- 25-26 Parsons Blvd Unit 2
- 25-30 Parsons Blvd
- 25-30 Parsons Blvd Unit 2
- 2532 Parsons Blvd
- 2524 Parsons Blvd
- 25-24 Parsons Blvd Unit 2