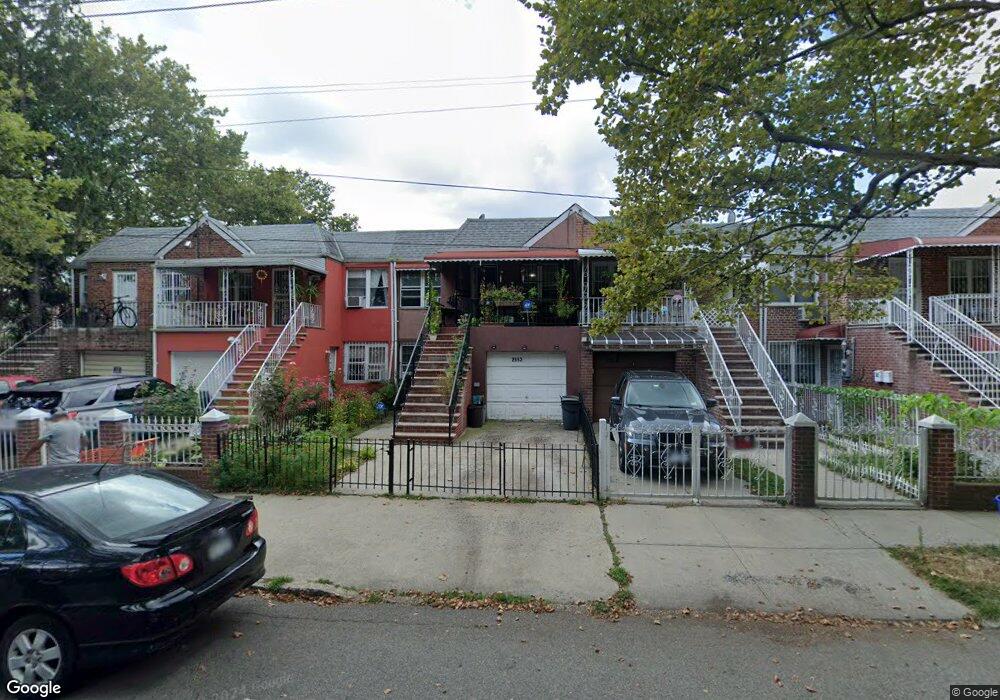
25-50 73rd St Unit 1 Flushing, NY 11370
Jackson Heights NeighborhoodEstimated Value: $927,450 - $1,027,000
1
Bed
1
Bath
1,632
Sq Ft
$605/Sq Ft
Est. Value
About This Home
This home is located at 25-50 73rd St Unit 1, Flushing, NY 11370 and is currently estimated at $987,363, approximately $605 per square foot. 25-50 73rd St Unit 1 is a home located in Queens County with nearby schools including Ps 152 Gwendolyn N Alleyne School, I.S. 230, and William Cullen Bryant High School.
Ownership History
Date
Name
Owned For
Owner Type
Purchase Details
Closed on
Jul 26, 2021
Sold by
Castaneda Cindy M and Liz Cindy M
Bought by
Liu Yong Gui and Zhuo Chun Hua
Current Estimated Value
Home Financials for this Owner
Home Financials are based on the most recent Mortgage that was taken out on this home.
Original Mortgage
$547,200
Outstanding Balance
$498,316
Interest Rate
3%
Mortgage Type
Purchase Money Mortgage
Estimated Equity
$489,047
Purchase Details
Closed on
Mar 6, 2001
Sold by
Zafra Jose A and Zafra Alexandra B
Bought by
Liz Cindy M
Home Financials for this Owner
Home Financials are based on the most recent Mortgage that was taken out on this home.
Original Mortgage
$284,750
Interest Rate
7.05%
Create a Home Valuation Report for This Property
The Home Valuation Report is an in-depth analysis detailing your home's value as well as a comparison with similar homes in the area
Home Values in the Area
Average Home Value in this Area
Purchase History
| Date | Buyer | Sale Price | Title Company |
|---|---|---|---|
| Liu Yong Gui | $912,000 | -- | |
| Liz Cindy M | $335,000 | First American Title Ins Co | |
| Liz Cindy M | $335,000 | First American Title Ins Co |
Source: Public Records
Mortgage History
| Date | Status | Borrower | Loan Amount |
|---|---|---|---|
| Open | Liu Yong Gui | $547,200 | |
| Previous Owner | Liz Cindy M | $284,750 |
Source: Public Records
Tax History Compared to Growth
Tax History
| Year | Tax Paid | Tax Assessment Tax Assessment Total Assessment is a certain percentage of the fair market value that is determined by local assessors to be the total taxable value of land and additions on the property. | Land | Improvement |
|---|---|---|---|---|
| 2025 | $8,560 | $44,191 | $7,365 | $36,826 |
| 2024 | $8,560 | $42,618 | $7,509 | $35,109 |
| 2023 | $8,076 | $40,210 | $6,084 | $34,126 |
| 2022 | $8,027 | $55,980 | $9,060 | $46,920 |
| 2021 | $8,215 | $50,820 | $9,060 | $41,760 |
| 2020 | $7,795 | $50,100 | $9,060 | $41,040 |
| 2019 | $7,429 | $49,920 | $9,060 | $40,860 |
| 2018 | $6,831 | $33,508 | $8,006 | $25,502 |
| 2017 | $6,831 | $33,508 | $7,076 | $26,432 |
| 2016 | $6,503 | $33,508 | $7,076 | $26,432 |
| 2015 | $3,813 | $30,688 | $8,828 | $21,860 |
| 2014 | $3,813 | $29,596 | $8,975 | $20,621 |
Source: Public Records
Map
Nearby Homes