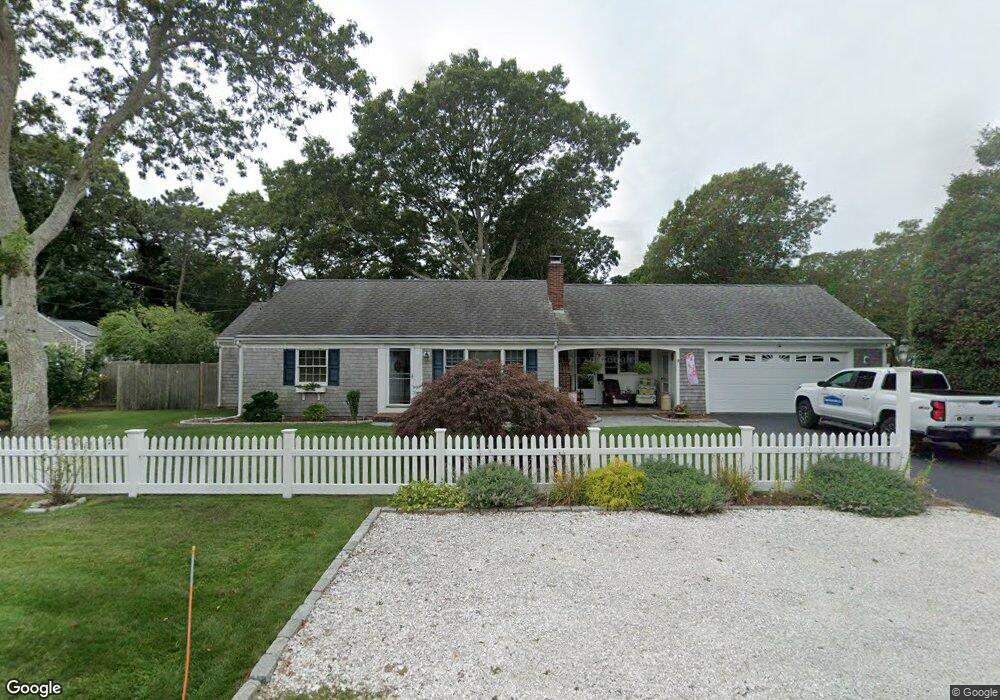
25 Almira Rd South Yarmouth, MA 02664
Estimated Value: $610,000 - $685,000
2
Beds
2
Baths
1,201
Sq Ft
$525/Sq Ft
Est. Value
About This Home
This home is located at 25 Almira Rd, South Yarmouth, MA 02664 and is currently estimated at $630,487, approximately $524 per square foot. 25 Almira Rd is a home located in Barnstable County with nearby schools including Dennis-Yarmouth Regional High School and St. Pius X. School.
Ownership History
Date
Name
Owned For
Owner Type
Purchase Details
Closed on
May 21, 2021
Sold by
Hedin David P and Mathews Jill M
Bought by
D P & J M Hedin 2021 Lt
Current Estimated Value
Purchase Details
Closed on
Oct 25, 1996
Sold by
Vankleeck William W
Bought by
Mathews Jill M and Hedin David T
Create a Home Valuation Report for This Property
The Home Valuation Report is an in-depth analysis detailing your home's value as well as a comparison with similar homes in the area
Home Values in the Area
Average Home Value in this Area
Purchase History
| Date | Buyer | Sale Price | Title Company |
|---|---|---|---|
| D P & J M Hedin 2021 Lt | -- | None Available | |
| Mathews Jill M | $118,000 | -- |
Source: Public Records
Mortgage History
| Date | Status | Borrower | Loan Amount |
|---|---|---|---|
| Previous Owner | Mathews Jill M | $120,100 | |
| Previous Owner | Mathews Jill M | $120,000 | |
| Previous Owner | Mathews Jill M | $112,000 |
Source: Public Records
Tax History Compared to Growth
Tax History
| Year | Tax Paid | Tax Assessment Tax Assessment Total Assessment is a certain percentage of the fair market value that is determined by local assessors to be the total taxable value of land and additions on the property. | Land | Improvement |
|---|---|---|---|---|
| 2025 | $3,905 | $551,500 | $178,900 | $372,600 |
| 2024 | $3,646 | $494,100 | $151,300 | $342,800 |
| 2023 | $3,536 | $436,000 | $131,000 | $305,000 |
| 2022 | $3,332 | $363,000 | $119,000 | $244,000 |
| 2021 | $3,123 | $326,700 | $119,000 | $207,700 |
| 2020 | $3,049 | $304,900 | $119,000 | $185,900 |
| 2019 | $2,816 | $278,800 | $119,000 | $159,800 |
| 2018 | $2,688 | $261,200 | $101,400 | $159,800 |
| 2017 | $2,573 | $256,800 | $97,000 | $159,800 |
| 2016 | $2,475 | $248,000 | $88,200 | $159,800 |
| 2015 | $2,367 | $235,800 | $88,200 | $147,600 |
Source: Public Records
Map
Nearby Homes