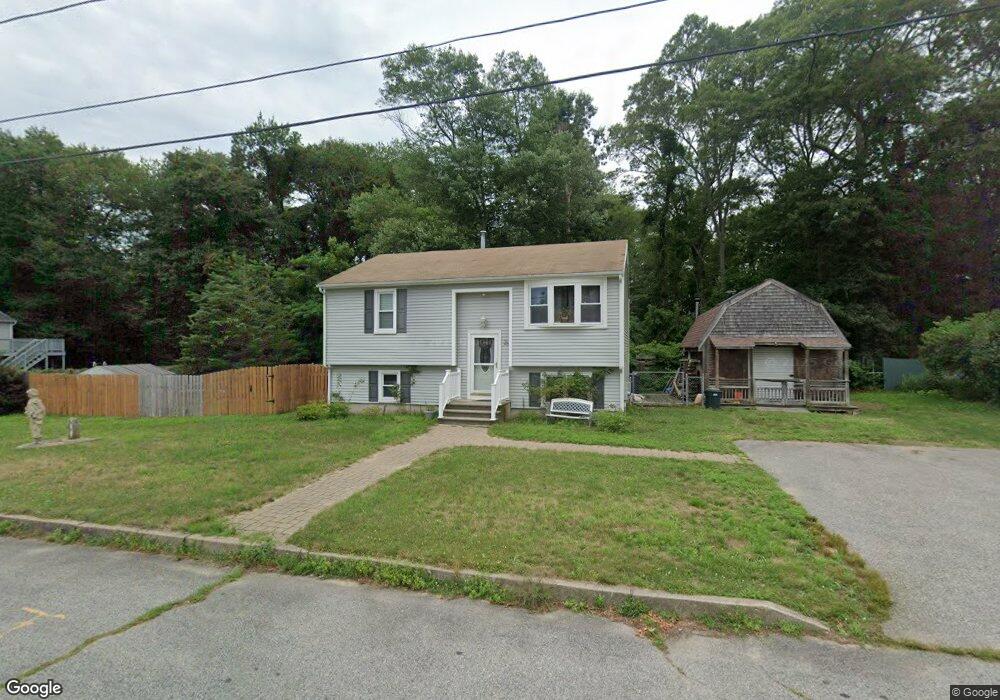
25 Arden Ct Warwick, RI 02889
Long Meadow NeighborhoodEstimated Value: $363,000 - $395,000
2
Beds
1
Bath
878
Sq Ft
$429/Sq Ft
Est. Value
About This Home
This home is located at 25 Arden Ct, Warwick, RI 02889 and is currently estimated at $376,993, approximately $429 per square foot. 25 Arden Ct is a home located in Kent County with nearby schools including Saint Kevin School and Bishop Hendricken High School.
Ownership History
Date
Name
Owned For
Owner Type
Purchase Details
Closed on
Apr 30, 2004
Sold by
Marshall Paul D
Bought by
Sampson Daniel B and Sampson Jenni A
Current Estimated Value
Home Financials for this Owner
Home Financials are based on the most recent Mortgage that was taken out on this home.
Original Mortgage
$175,273
Interest Rate
5.36%
Mortgage Type
VA
Create a Home Valuation Report for This Property
The Home Valuation Report is an in-depth analysis detailing your home's value as well as a comparison with similar homes in the area
Home Values in the Area
Average Home Value in this Area
Purchase History
| Date | Buyer | Sale Price | Title Company |
|---|---|---|---|
| Sampson Daniel B | $172,000 | -- |
Source: Public Records
Mortgage History
| Date | Status | Borrower | Loan Amount |
|---|---|---|---|
| Open | Sampson Daniel B | $152,378 | |
| Closed | Sampson Daniel B | $175,273 | |
| Previous Owner | Sampson Daniel B | $128,397 | |
| Previous Owner | Sampson Daniel B | $15,500 |
Source: Public Records
Tax History
| Year | Tax Paid | Tax Assessment Tax Assessment Total Assessment is a certain percentage of the fair market value that is determined by local assessors to be the total taxable value of land and additions on the property. | Land | Improvement |
|---|---|---|---|---|
| 2025 | $4,596 | $361,900 | $118,300 | $243,600 |
| 2024 | $4,519 | $312,300 | $102,800 | $209,500 |
| 2023 | $4,432 | $312,300 | $102,800 | $209,500 |
| 2022 | $4,259 | $227,400 | $66,700 | $160,700 |
| 2021 | $4,259 | $227,400 | $66,700 | $160,700 |
| 2020 | $4,018 | $214,500 | $66,700 | $147,800 |
| 2019 | $4,018 | $214,500 | $66,700 | $147,800 |
| 2018 | $3,571 | $171,700 | $66,700 | $105,000 |
| 2017 | $3,475 | $171,700 | $66,700 | $105,000 |
| 2016 | $3,475 | $171,700 | $66,700 | $105,000 |
| 2015 | $3,096 | $149,200 | $61,200 | $88,000 |
| 2014 | $2,993 | $149,200 | $61,200 | $88,000 |
| 2013 | $2,953 | $149,200 | $61,200 | $88,000 |
Source: Public Records
Map
Nearby Homes
- 46 Verndale St
- 355 Church Ave
- 103 Brightside Ave
- 39 Damon Ave
- 2 Overbrook Ave
- 17 Ardway Ave
- 101 Farmland Rd
- 35 Transit St
- 112 Old Warwick Ave
- 37 Fulton St
- 11 Heights Ave
- 266 Vineyard Rd
- 25 Webb Ave
- 17 Wuddall Ave
- 18 Sevilla Ave
- 63 Ramblewood Dr
- 19 Beatrice Ave
- 14 Beatrice Ave
- 150 Mill Cove Rd
- 108 Fern St
Your Personal Tour Guide
Ask me questions while you tour the home.