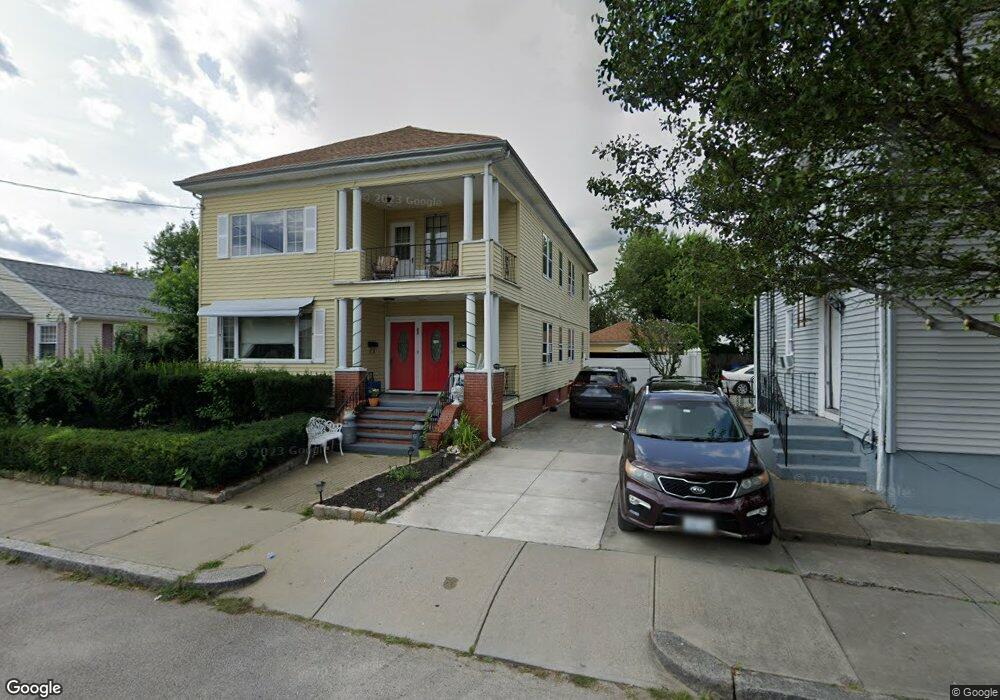
25 Bailey St Unit 27 Cranston, RI 02920
Arlington NeighborhoodEstimated Value: $519,272 - $644,000
6
Beds
2
Baths
2,912
Sq Ft
$199/Sq Ft
Est. Value
About This Home
This home is located at 25 Bailey St Unit 27, Cranston, RI 02920 and is currently estimated at $580,818, approximately $199 per square foot. 25 Bailey St Unit 27 is a home located in Providence County with nearby schools including Hugh B. Bain Middle School, Cranston High School East, and Achievement First Iluminar Mayoral Academy.
Ownership History
Date
Name
Owned For
Owner Type
Purchase Details
Closed on
Aug 26, 2004
Sold by
Colella Guiseppe and Colella Assunta
Bought by
Reyes Yvan and Blanco Indiana
Current Estimated Value
Home Financials for this Owner
Home Financials are based on the most recent Mortgage that was taken out on this home.
Original Mortgage
$244,000
Interest Rate
6.02%
Mortgage Type
Purchase Money Mortgage
Create a Home Valuation Report for This Property
The Home Valuation Report is an in-depth analysis detailing your home's value as well as a comparison with similar homes in the area
Home Values in the Area
Average Home Value in this Area
Purchase History
| Date | Buyer | Sale Price | Title Company |
|---|---|---|---|
| Reyes Yvan | $305,000 | -- |
Source: Public Records
Mortgage History
| Date | Status | Borrower | Loan Amount |
|---|---|---|---|
| Open | Reyes Yvan | $333,000 | |
| Closed | Reyes Yvan | $244,000 |
Source: Public Records
Tax History Compared to Growth
Tax History
| Year | Tax Paid | Tax Assessment Tax Assessment Total Assessment is a certain percentage of the fair market value that is determined by local assessors to be the total taxable value of land and additions on the property. | Land | Improvement |
|---|---|---|---|---|
| 2024 | $5,911 | $434,300 | $106,900 | $327,400 |
| 2023 | $5,077 | $268,600 | $46,900 | $221,700 |
| 2022 | $4,972 | $268,600 | $46,900 | $221,700 |
| 2021 | $4,835 | $268,600 | $46,900 | $221,700 |
| 2020 | $4,443 | $213,900 | $36,900 | $177,000 |
| 2019 | $4,443 | $213,900 | $36,900 | $177,000 |
| 2018 | $4,340 | $213,900 | $36,900 | $177,000 |
| 2017 | $3,762 | $164,000 | $16,800 | $147,200 |
| 2016 | $3,682 | $164,000 | $16,800 | $147,200 |
| 2015 | $3,682 | $164,000 | $16,800 | $147,200 |
| 2014 | $3,227 | $141,300 | $16,800 | $124,500 |
Source: Public Records
Map
Nearby Homes