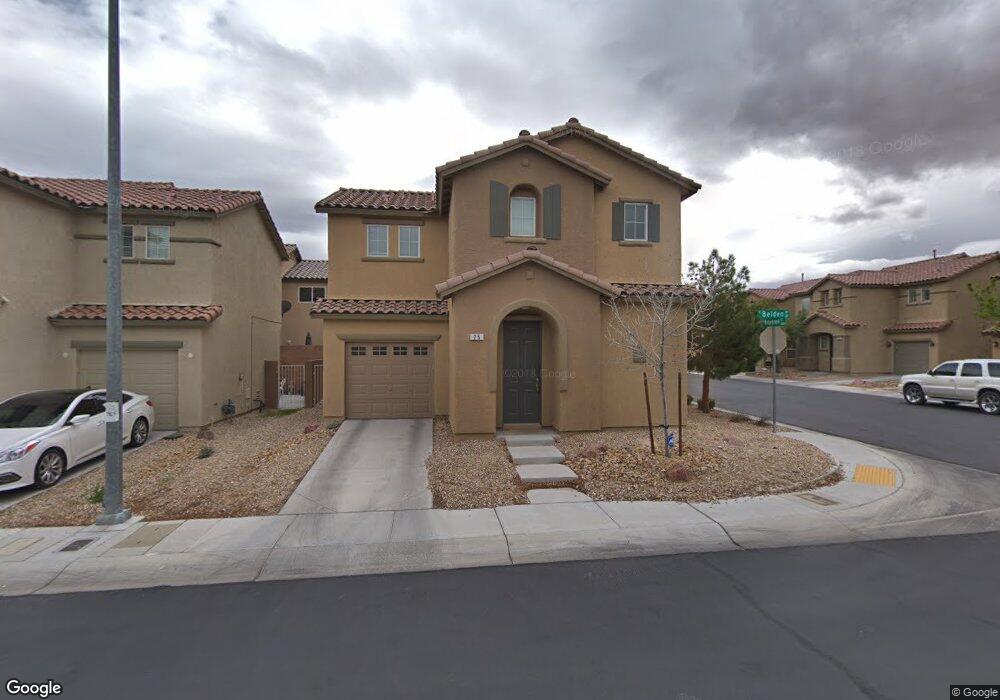
25 Belden Ave Unit 3 Las Vegas, NV 89183
Silverado Ranch NeighborhoodEstimated Value: $386,000 - $407,000
3
Beds
3
Baths
1,650
Sq Ft
$238/Sq Ft
Est. Value
About This Home
This home is located at 25 Belden Ave Unit 3, Las Vegas, NV 89183 and is currently estimated at $393,350, approximately $238 per square foot. 25 Belden Ave Unit 3 is a home located in Clark County with nearby schools including Steve Schorr Elementary School, Del E. Webb Middle School, and Liberty High School.
Ownership History
Date
Name
Owned For
Owner Type
Purchase Details
Closed on
Dec 14, 2011
Sold by
Joys Properties Llc
Bought by
Heft Jaimie Alaisha
Current Estimated Value
Home Financials for this Owner
Home Financials are based on the most recent Mortgage that was taken out on this home.
Original Mortgage
$109,160
Outstanding Balance
$75,528
Interest Rate
4.25%
Mortgage Type
FHA
Estimated Equity
$317,822
Purchase Details
Closed on
Oct 11, 2011
Sold by
Moi Wai Man
Bought by
Joys Properties Llc
Purchase Details
Closed on
Dec 31, 2006
Sold by
Moi Ling Fang
Bought by
Moi Wai Man
Home Financials for this Owner
Home Financials are based on the most recent Mortgage that was taken out on this home.
Original Mortgage
$198,412
Interest Rate
6.62%
Mortgage Type
Unknown
Create a Home Valuation Report for This Property
The Home Valuation Report is an in-depth analysis detailing your home's value as well as a comparison with similar homes in the area
Home Values in the Area
Average Home Value in this Area
Purchase History
| Date | Buyer | Sale Price | Title Company |
|---|---|---|---|
| Heft Jaimie Alaisha | $112,000 | Lawyers Title Of Nevada Hen | |
| Joys Properties Llc | $84,600 | Accommodation | |
| Moi Wai Man | -- | First Amer Title Co Of Nv | |
| Moi Wai Man | $248,016 | First Amer Title Co Of Nv |
Source: Public Records
Mortgage History
| Date | Status | Borrower | Loan Amount |
|---|---|---|---|
| Open | Heft Jaimie Alaisha | $109,160 | |
| Previous Owner | Moi Wai Man | $198,412 |
Source: Public Records
Tax History Compared to Growth
Tax History
| Year | Tax Paid | Tax Assessment Tax Assessment Total Assessment is a certain percentage of the fair market value that is determined by local assessors to be the total taxable value of land and additions on the property. | Land | Improvement |
|---|---|---|---|---|
| 2025 | $1,621 | $104,414 | $35,000 | $69,414 |
| 2024 | $1,574 | $104,414 | $35,000 | $69,414 |
| 2023 | $1,152 | $95,502 | $30,100 | $65,402 |
| 2022 | $1,602 | $83,031 | $23,450 | $59,581 |
| 2021 | $1,484 | $78,622 | $22,050 | $56,572 |
| 2020 | $1,375 | $78,052 | $22,050 | $56,002 |
| 2019 | $1,289 | $73,518 | $18,550 | $54,968 |
| 2018 | $1,230 | $67,133 | $14,700 | $52,433 |
| 2017 | $1,953 | $66,607 | $13,650 | $52,957 |
| 2016 | $1,152 | $56,663 | $10,150 | $46,513 |
| 2015 | $1,149 | $41,858 | $8,050 | $33,808 |
| 2014 | $1,113 | $36,820 | $3,500 | $33,320 |
Source: Public Records
Map
Nearby Homes
- 11882 Snow Bank St
- 11894 Snow Bank St
- 57 Foxworth Ct
- 25 Barbara Ln Unit 53
- 25 Barbara Ln Unit 62
- 25 Barbara Ln Unit 26
- 104 Masserta Ct
- 72 Dark Creek Ave
- 11934 Wild Chamomile St
- 142 Trumphet Lilly Ave
- 11746 Magliana St
- 11862 Partenio Ct
- 11769 Elianto St
- 68 Jewel Mine Ave
- 20 Barbara Ln Unit 58
- 20 Barbara Ln Unit 47
- 144 Bella Milano Ave
- 11771 Bergamo Ct
- 11819 Bella Luna St
- 12104 Mojave Gold Rd Unit 4
- 29 Belden Ave
- 22 Dovewood Ave
- 26 Dovewood Ave
- 33 Belden Ave
- 30 Dovewood Ave
- 28 Belden Ave
- 11875 Wedgebrook St
- 24 Belden Ave
- 11881 Wedgebrook St
- 32 Belden Ave
- 20 Belden Ave
- 37 Belden Ave
- 18 Belden Ave
- 11887 Wedgebrook St
- 34 Dovewood Ave
- 36 Belden Ave
- 23 Dovewood Ave
- 11893 Wedgebrook St
- 11893 Wedgebrook St Unit na
- 27 Dovewood Ave