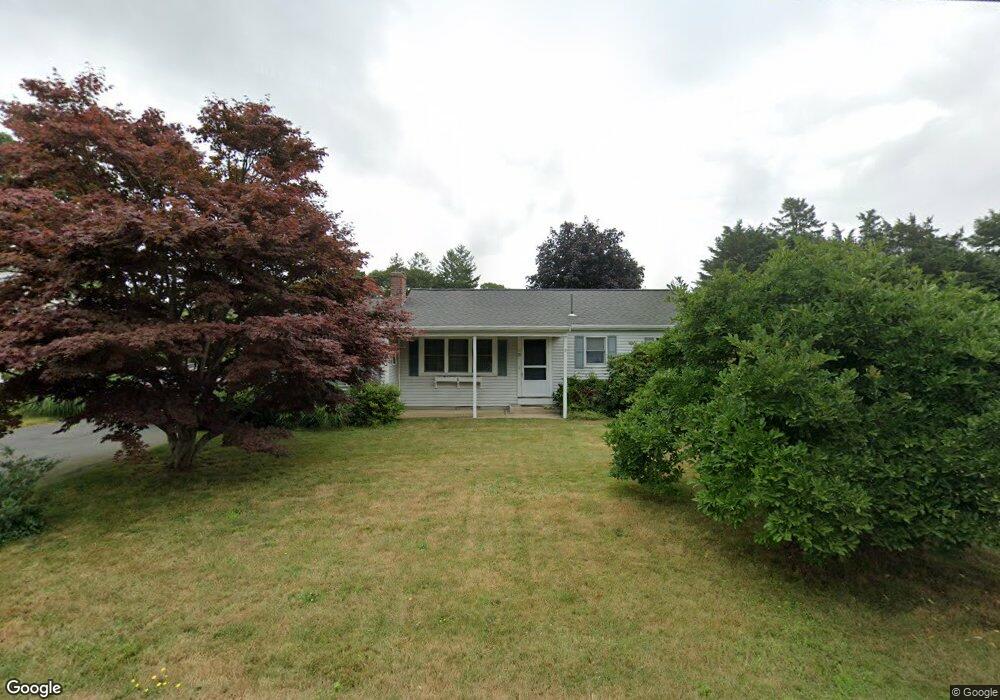
25 Bellavista Dr Pocasset, MA 02559
Pocasset NeighborhoodEstimated Value: $650,000 - $805,000
3
Beds
2
Baths
1,079
Sq Ft
$683/Sq Ft
Est. Value
About This Home
This home is located at 25 Bellavista Dr, Pocasset, MA 02559 and is currently estimated at $736,746, approximately $682 per square foot. 25 Bellavista Dr is a home located in Barnstable County with nearby schools including Bourne High School and Cadence Academy Preschool - Bourne.
Ownership History
Date
Name
Owned For
Owner Type
Purchase Details
Closed on
Oct 9, 2024
Sold by
Fernandes Alex R
Bought by
Fernandes Alex R and Fernandes Paulina M
Current Estimated Value
Purchase Details
Closed on
Nov 8, 2022
Sold by
Fernandes Catherine
Bought by
Fernandes Catherine and Fernandes Alex R
Purchase Details
Closed on
Aug 15, 2014
Sold by
Day Lucille M
Bought by
Fernandes Catherine
Purchase Details
Closed on
Dec 10, 2012
Sold by
Day Lucille M
Bought by
Day Lucille M and Smith Linda K
Create a Home Valuation Report for This Property
The Home Valuation Report is an in-depth analysis detailing your home's value as well as a comparison with similar homes in the area
Home Values in the Area
Average Home Value in this Area
Purchase History
| Date | Buyer | Sale Price | Title Company |
|---|---|---|---|
| Fernandes Alex R | -- | None Available | |
| Fernandes Alex R | -- | None Available | |
| Fernandes Catherine | -- | None Available | |
| Fernandes Catherine | -- | None Available | |
| Fernandes Catherine | $321,000 | -- | |
| Day Lucille M | -- | -- | |
| Day Lucille M | -- | -- | |
| Day Lucille M | -- | -- | |
| Fernandes Catherine | $321,000 | -- | |
| Day Lucille M | -- | -- |
Source: Public Records
Tax History Compared to Growth
Tax History
| Year | Tax Paid | Tax Assessment Tax Assessment Total Assessment is a certain percentage of the fair market value that is determined by local assessors to be the total taxable value of land and additions on the property. | Land | Improvement |
|---|---|---|---|---|
| 2025 | $4,441 | $568,600 | $326,600 | $242,000 |
| 2024 | $4,342 | $541,400 | $311,000 | $230,400 |
| 2023 | $4,074 | $462,400 | $252,300 | $210,100 |
| 2022 | $3,954 | $391,900 | $223,300 | $168,600 |
| 2021 | $3,855 | $357,900 | $203,200 | $154,700 |
| 2020 | $3,767 | $350,700 | $201,300 | $149,400 |
| 2019 | $3,606 | $343,100 | $201,300 | $141,800 |
| 2018 | $3,384 | $321,100 | $191,700 | $129,400 |
| 2017 | $3,230 | $313,600 | $189,900 | $123,700 |
| 2016 | $2,928 | $288,200 | $166,900 | $121,300 |
| 2015 | $2,755 | $273,600 | $166,900 | $106,700 |
Source: Public Records
Map
Nearby Homes
- 171 Bellavista Dr
- 34 Kenwood Rd
- 45 Kenwood Rd
- 70 Wings Neck Rd
- 254 Barlows Landing Rd
- 24 Richmond Rd
- 14 Navajo Rd
- 940 County Rd
- 22 Nairn Rd
- 709 County Rd
- 174 Barlows Landing Rd
- 89 Harbor Dr
- 39 Bennets Neck Dr
- 15 1st St
- 7 4th Ave
- 48 Red Brook Harbor Rd
- 3 Red Brook Pond Dr
- 940 County Rd
- 1094 County Rd
- 27 Bellavista Dr
- 23 Bellavista Dr
- 890 Shore Rd
- 892 Shore Rd
- 24 Bellavista Dr
- 886 Shore Rd
- 894 Shore Rd
- 28 Bellavista Dr
- 22 Bellavista Dr
- 21 Bellavista Dr
- 29 Bellavista Dr
- 3 Vincent Dr
- 882 Shore Rd
- 30 Bellavista Dr
- 31 Bellavista Dr
- 893 Shore Rd
- 32 Bellavista Dr
- 885 Shore Rd
- 16 Andrea Rd
- 20 Bellavista Dr