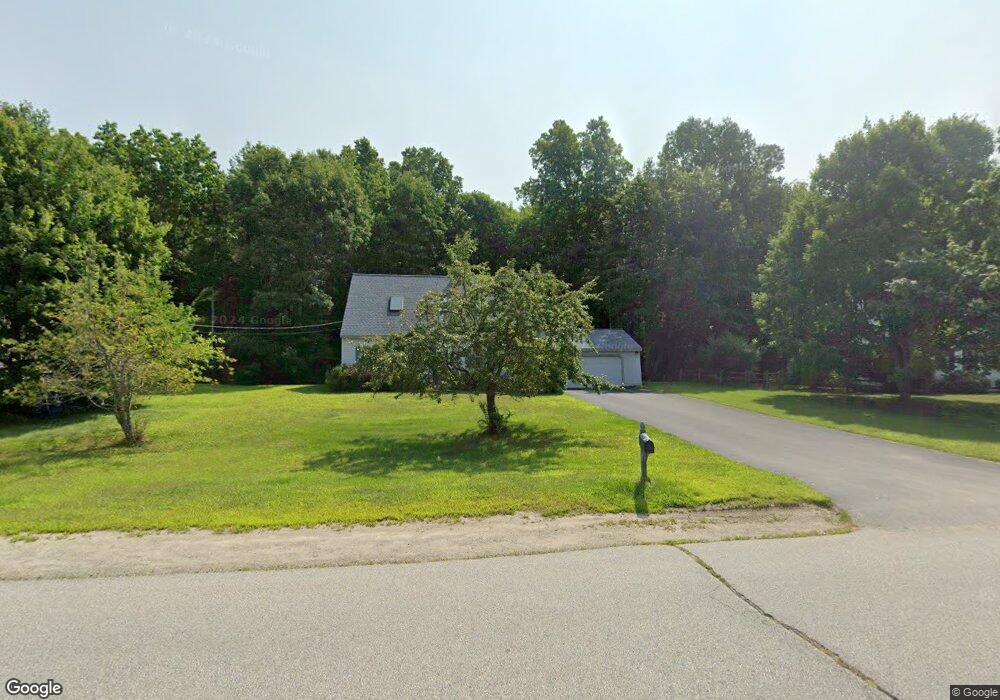
25 Bennett Way Newmarket, NH 03857
Estimated Value: $564,000 - $622,693
3
Beds
3
Baths
1,764
Sq Ft
$339/Sq Ft
Est. Value
About This Home
This home is located at 25 Bennett Way, Newmarket, NH 03857 and is currently estimated at $597,673, approximately $338 per square foot. 25 Bennett Way is a home located in Rockingham County with nearby schools including Newmarket Elementary School, Newmarket Junior High School, and Newmarket Senior High School.
Ownership History
Date
Name
Owned For
Owner Type
Purchase Details
Closed on
Sep 17, 1999
Sold by
Boysen Carolyn M and Boysen Andrew A
Bought by
Metts Celeste A
Current Estimated Value
Home Financials for this Owner
Home Financials are based on the most recent Mortgage that was taken out on this home.
Original Mortgage
$132,000
Interest Rate
7.83%
Purchase Details
Closed on
Jun 10, 1998
Sold by
Filion Ret Robert L and Filion Rvkbl T Helen L
Bought by
Boysen Carolyn M and Boysen Andrew A
Home Financials for this Owner
Home Financials are based on the most recent Mortgage that was taken out on this home.
Original Mortgage
$103,900
Interest Rate
7.11%
Create a Home Valuation Report for This Property
The Home Valuation Report is an in-depth analysis detailing your home's value as well as a comparison with similar homes in the area
Home Values in the Area
Average Home Value in this Area
Purchase History
| Date | Buyer | Sale Price | Title Company |
|---|---|---|---|
| Metts Celeste A | $165,000 | -- | |
| Boysen Carolyn M | $129,900 | -- |
Source: Public Records
Mortgage History
| Date | Status | Borrower | Loan Amount |
|---|---|---|---|
| Open | Boysen Carolyn M | $242,500 | |
| Closed | Boysen Carolyn M | $248,000 | |
| Closed | Boysen Carolyn M | $132,000 | |
| Previous Owner | Boysen Carolyn M | $103,900 |
Source: Public Records
Tax History Compared to Growth
Tax History
| Year | Tax Paid | Tax Assessment Tax Assessment Total Assessment is a certain percentage of the fair market value that is determined by local assessors to be the total taxable value of land and additions on the property. | Land | Improvement |
|---|---|---|---|---|
| 2024 | $9,044 | $525,800 | $226,700 | $299,100 |
| 2023 | $9,207 | $312,200 | $129,600 | $182,600 |
| 2022 | $8,426 | $312,200 | $129,600 | $182,600 |
| 2021 | $8,230 | $312,200 | $129,600 | $182,600 |
| 2020 | $7,949 | $312,200 | $129,600 | $182,600 |
| 2018 | $7,167 | $245,100 | $76,600 | $168,500 |
| 2017 | $6,552 | $245,100 | $76,600 | $168,500 |
| 2016 | $6,238 | $245,100 | $76,600 | $168,500 |
| 2015 | $6,118 | $245,100 | $76,600 | $168,500 |
| 2014 | $6,311 | $245,100 | $76,600 | $168,500 |
| 2013 | $6,208 | $253,800 | $74,500 | $179,300 |
| 2012 | $6,007 | $253,800 | $74,500 | $179,300 |
Source: Public Records
Map
Nearby Homes
- 16 Bennett Way
- 24 Lilac Ln
- 0 Pear Tree Ln Unit 9
- 0 Pear Tree Ln Unit 10
- 325 Lita Ln
- 90 Colgate Rd
- 23 Columbia Dr
- 13 Moonlight Dr
- 85 Princeton St
- 141 Hersey Ln
- 30 Honeycomb Way
- 16 Railroad St
- 21 Briallia Cir
- 8 Stonewall Way
- 11 Creighton St
- 2 Chapel St
- 125 Main St Unit 39
- 29 Hamel Farm Dr
- 411 Ash Swamp Rd
- 10 Merrill Ln