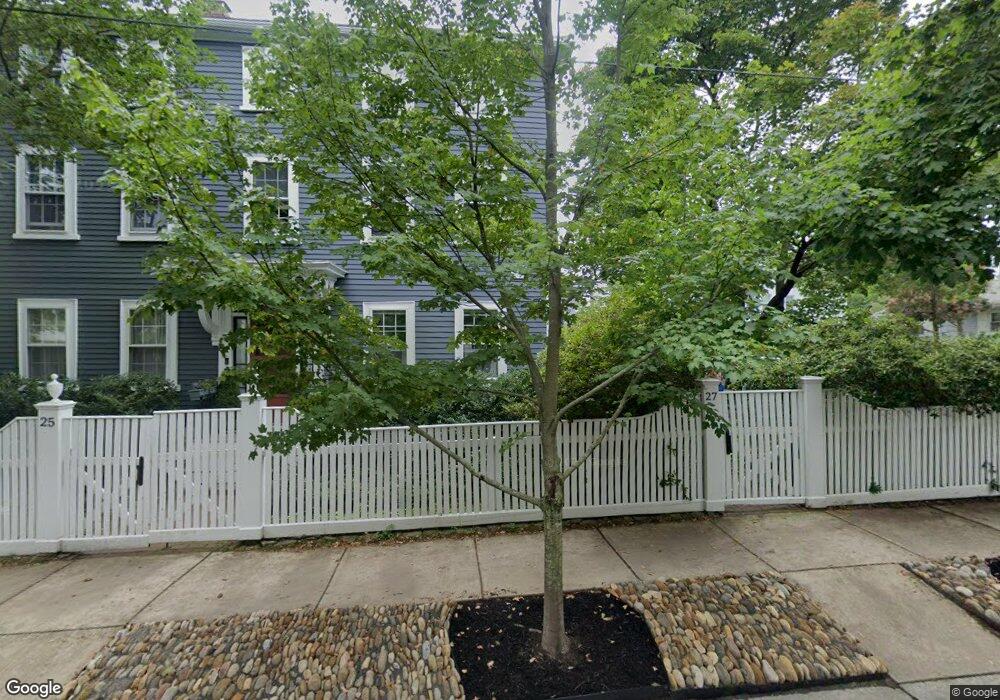
25 Buffum St Unit 27 Salem, MA 01970
North Salem NeighborhoodEstimated Value: $941,000 - $1,157,084
5
Beds
5
Baths
4,385
Sq Ft
$237/Sq Ft
Est. Value
About This Home
This home is located at 25 Buffum St Unit 27, Salem, MA 01970 and is currently estimated at $1,040,521, approximately $237 per square foot. 25 Buffum St Unit 27 is a home located in Essex County with nearby schools including Bates Elementary School, Saltonstall School, and Carlton Elementary School.
Ownership History
Date
Name
Owned For
Owner Type
Purchase Details
Closed on
Oct 19, 2021
Sold by
Pangallo Karen L and Pangallo Salvatore D
Bought by
S D & Karen L Pangallo Lt
Current Estimated Value
Purchase Details
Closed on
Jan 1, 1978
Bought by
Pangallo Salvatore D and Pangallo Karen L
Create a Home Valuation Report for This Property
The Home Valuation Report is an in-depth analysis detailing your home's value as well as a comparison with similar homes in the area
Home Values in the Area
Average Home Value in this Area
Purchase History
| Date | Buyer | Sale Price | Title Company |
|---|---|---|---|
| S D & Karen L Pangallo Lt | -- | None Available | |
| Pangallo Salvatore D | $48,500 | -- |
Source: Public Records
Mortgage History
| Date | Status | Borrower | Loan Amount |
|---|---|---|---|
| Previous Owner | Pangallo Salvatore D | $150,000 | |
| Previous Owner | Pangallo Salvatore D | $25,000 | |
| Previous Owner | Pangallo Salvatore D | $43,000 |
Source: Public Records
Tax History
| Year | Tax Paid | Tax Assessment Tax Assessment Total Assessment is a certain percentage of the fair market value that is determined by local assessors to be the total taxable value of land and additions on the property. | Land | Improvement |
|---|---|---|---|---|
| 2025 | $12,220 | $1,077,600 | $220,600 | $857,000 |
| 2024 | $10,902 | $938,200 | $209,600 | $728,600 |
| 2023 | $10,593 | $846,800 | $193,500 | $653,300 |
| 2022 | $10,563 | $797,200 | $187,100 | $610,100 |
| 2021 | $9,966 | $722,200 | $174,200 | $548,000 |
| 2020 | $9,602 | $664,500 | $164,500 | $500,000 |
| 2019 | $9,490 | $628,500 | $156,100 | $472,400 |
| 2018 | $8,779 | $570,800 | $148,400 | $422,400 |
| 2017 | $7,765 | $489,600 | $125,100 | $364,500 |
| 2016 | $7,581 | $483,800 | $119,300 | $364,500 |
| 2015 | $7,596 | $462,900 | $109,700 | $353,200 |
Source: Public Records
Map
Nearby Homes
- 40 Buffum St Unit 2
- 40 Buffum St Unit 1
- 112 North St
- 21 Manning St
- 3 S Mason St
- 44 Orne St Unit 44
- 16 Franklin St Unit 2403
- 16 Franklin St Unit 1303
- 16 River St
- 23 River St
- 86 Flint St
- 16 Oakland St
- 41 Dearborn St
- 17 North St Unit 2
- 9 Highland St
- 35 Flint St Unit 209
- 35 Flint St Unit 106
- 289 Essex St Unit 211
- 11 Summer St
- 65 Washington St Unit 512
- 5 Harmony St
- 29 Buffum St
- 21 Buffum St
- 21 1/2 Buffum St
- 7 Harmony St
- 7 Harmony St
- 68 Harmony St
- 8 Harmony St Unit 8
- 6 Harmony St Unit 6
- 32 Buffum St Unit 1
- 32 Buffum St
- 32 Buffum St Unit 2
- 34 Buffum St Unit 3
- 34 Buffum St Unit 4
- 28 Buffum St Unit 28A
- 22 Barr St
- 19 Buffum St
- 20 Barr St
- 28 Barr St Unit 30
- 31 1/2 Buffum St
Your Personal Tour Guide
Ask me questions while you tour the home.