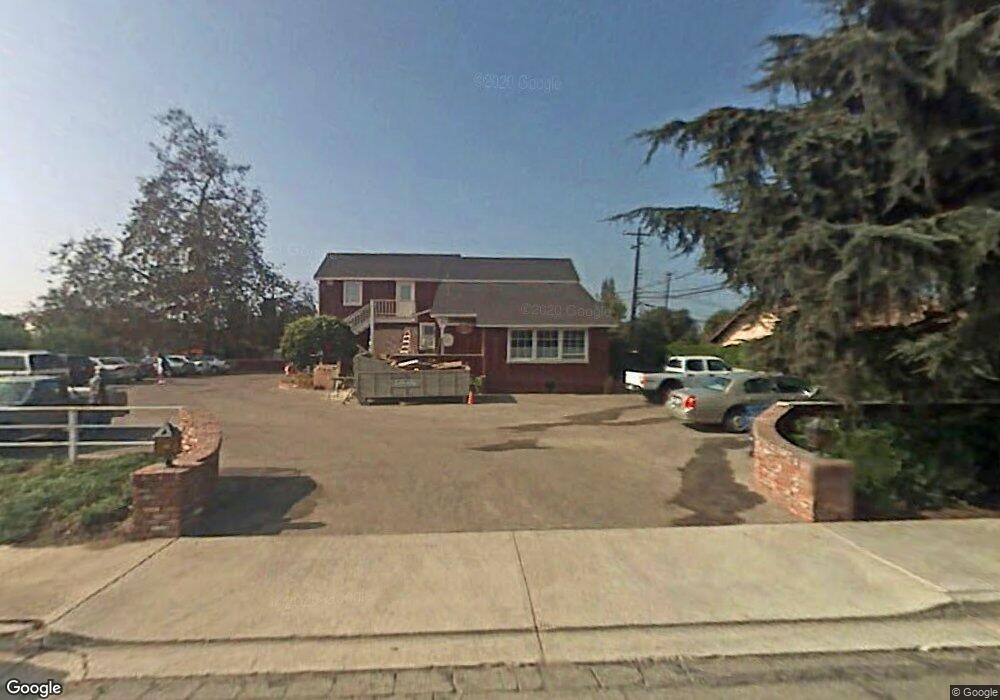
25 Carlo Dr Unit D&E Goleta, CA 93117
Estimated Value: $1,690,389
Studio
2
Baths
3,583
Sq Ft
$472/Sq Ft
Est. Value
About This Home
This home is located at 25 Carlo Dr Unit D&E, Goleta, CA 93117 and is currently estimated at $1,690,389, approximately $471 per square foot. 25 Carlo Dr Unit D&E is a home located in Santa Barbara County with nearby schools including Goleta Valley Junior High School, Dos Pueblos Senior High School, and Montessori Center School of Santa Barbara.
Ownership History
Date
Name
Owned For
Owner Type
Purchase Details
Closed on
Jul 14, 2021
Sold by
Neuman Susan M and The Lauren T Mcewen Trust
Bought by
25 Carlo Drive Llc
Current Estimated Value
Home Financials for this Owner
Home Financials are based on the most recent Mortgage that was taken out on this home.
Original Mortgage
$500,000
Outstanding Balance
$453,672
Interest Rate
2.9%
Mortgage Type
Unknown
Estimated Equity
$1,236,717
Purchase Details
Closed on
Oct 13, 2010
Sold by
Neuman Susan T
Bought by
Neuman Susan T
Purchase Details
Closed on
Sep 23, 2002
Sold by
Taylor Rowena B
Bought by
Taylor Rowena B and Taylor Family Trust
Purchase Details
Closed on
Nov 16, 1993
Sold by
Taylor Charles M and Taylor Rowena B
Bought by
Taylor Charles M and Taylor Rowena B
Create a Home Valuation Report for This Property
The Home Valuation Report is an in-depth analysis detailing your home's value as well as a comparison with similar homes in the area
Home Values in the Area
Average Home Value in this Area
Purchase History
| Date | Buyer | Sale Price | Title Company |
|---|---|---|---|
| 25 Carlo Drive Llc | $1,350,000 | Fidelity National Title Co | |
| Neuman Susan T | -- | None Available | |
| Neuman Susan T | -- | None Available | |
| Taylor Rowena B | -- | -- | |
| Taylor Rowena B | -- | -- | |
| Taylor Charles M | -- | -- |
Source: Public Records
Mortgage History
| Date | Status | Borrower | Loan Amount |
|---|---|---|---|
| Open | 25 Carlo Drive Llc | $500,000 |
Source: Public Records
Tax History
| Year | Tax Paid | Tax Assessment Tax Assessment Total Assessment is a certain percentage of the fair market value that is determined by local assessors to be the total taxable value of land and additions on the property. | Land | Improvement |
|---|---|---|---|---|
| 2025 | $15,847 | $1,432,630 | $716,315 | $716,315 |
| 2023 | $15,847 | $1,377,000 | $688,500 | $688,500 |
| 2022 | $15,294 | $1,350,000 | $675,000 | $675,000 |
| 2021 | $11,925 | $1,010,098 | $588,768 | $421,330 |
| 2020 | $11,629 | $999,741 | $582,731 | $417,010 |
| 2019 | $11,526 | $980,139 | $571,305 | $408,834 |
| 2018 | $11,284 | $960,921 | $560,103 | $400,818 |
| 2017 | $11,085 | $942,080 | $549,121 | $392,959 |
| 2016 | $10,704 | $923,608 | $538,354 | $385,254 |
| 2014 | $10,493 | $891,916 | $519,881 | $372,035 |
Source: Public Records
Map
Nearby Homes
- 6242 Guava Ave
- 5930 Encina Rd
- 257 Moreton Bay Ln Unit 2
- 257 Moreton Bay Ln
- 5859 Mandarin Dr
- 0 N Fairview Ave Unit SR24087795
- 99 Nectarine Ave
- 00 N Fairview Ave
- 5740 Encina Rd Unit 3
- 571 Windsor Ave
- 5722 Encina Rd Unit 3
- 520 Pine Ave Unit 55
- 520 Pine Ave Unit 4
- 520 Pine Ave Unit 5
- 673 Rossmore Rd
- 5960 Matthews St
- 345 Kellogg Way Unit 18
- 345 Kellogg Way Unit 2
- 5518 Armitos Ave Unit 86
- 5510 Armitos Ave Unit 4
Your Personal Tour Guide
Ask me questions while you tour the home.