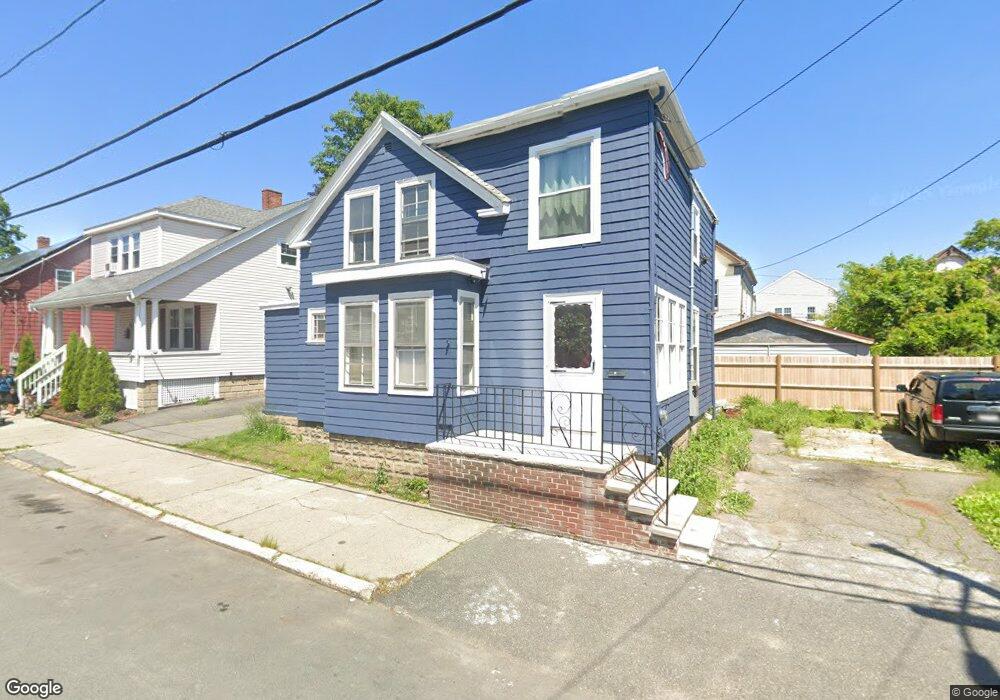
25 Cedar St Lynn, MA 01905
Pine Hill NeighborhoodEstimated Value: $462,000 - $559,000
2
Beds
2
Baths
1,228
Sq Ft
$417/Sq Ft
Est. Value
About This Home
This home is located at 25 Cedar St, Lynn, MA 01905 and is currently estimated at $512,515, approximately $417 per square foot. 25 Cedar St is a home located in Essex County with nearby schools including Tracy Elementary School, William R. Fallon School, and Fecteau-Leary Junior/Senior High School.
Ownership History
Date
Name
Owned For
Owner Type
Purchase Details
Closed on
May 14, 2021
Sold by
Landry Ft and Dyer
Bought by
Dyer Jacob R
Current Estimated Value
Home Financials for this Owner
Home Financials are based on the most recent Mortgage that was taken out on this home.
Original Mortgage
$218,250
Interest Rate
2.96%
Mortgage Type
Purchase Money Mortgage
Purchase Details
Closed on
Jul 17, 2012
Sold by
Landry Rita
Bought by
Landry Ft and Dyer
Create a Home Valuation Report for This Property
The Home Valuation Report is an in-depth analysis detailing your home's value as well as a comparison with similar homes in the area
Home Values in the Area
Average Home Value in this Area
Purchase History
| Date | Buyer | Sale Price | Title Company |
|---|---|---|---|
| Dyer Jacob R | $225,000 | None Available | |
| Dyer Jacob R | $225,000 | None Available | |
| Landry Ft | -- | -- |
Source: Public Records
Mortgage History
| Date | Status | Borrower | Loan Amount |
|---|---|---|---|
| Previous Owner | Dyer Jacob R | $218,250 |
Source: Public Records
Tax History
| Year | Tax Paid | Tax Assessment Tax Assessment Total Assessment is a certain percentage of the fair market value that is determined by local assessors to be the total taxable value of land and additions on the property. | Land | Improvement |
|---|---|---|---|---|
| 2025 | $4,673 | $451,100 | $179,000 | $272,100 |
| 2024 | $4,474 | $424,900 | $168,200 | $256,700 |
| 2023 | $4,315 | $387,000 | $163,000 | $224,000 |
| 2022 | $4,353 | $350,200 | $151,000 | $199,200 |
| 2021 | $4,306 | $330,500 | $145,000 | $185,500 |
| 2020 | $3,995 | $298,100 | $127,800 | $170,300 |
| 2019 | $3,782 | $264,500 | $104,500 | $160,000 |
| 2018 | $3,328 | $219,700 | $86,900 | $132,800 |
| 2017 | $3,093 | $198,300 | $73,700 | $124,600 |
| 2016 | $2,963 | $183,100 | $65,700 | $117,400 |
| 2015 | $2,734 | $163,200 | $61,300 | $101,900 |
Source: Public Records
Map
Nearby Homes
- 34 Grove St
- 16 Salem St
- 274 Boston St
- 66 Harwood St
- 50-50A Kirtland St
- 99 New Park St
- 78-80 Spencer St
- 136 Franklin St
- 73 Waterhill St
- 43 Baker St
- 20 Murray St
- 99 Franklin St
- 70 Wyman St
- 28 Wyman St
- 81A Franklin St
- 121 Johnson St Unit 3L
- 46 Wilfred St
- 51 Laighton St Unit 7
- 590 Boston St Unit 303
- 1 Hillcrest Ave
Your Personal Tour Guide
Ask me questions while you tour the home.