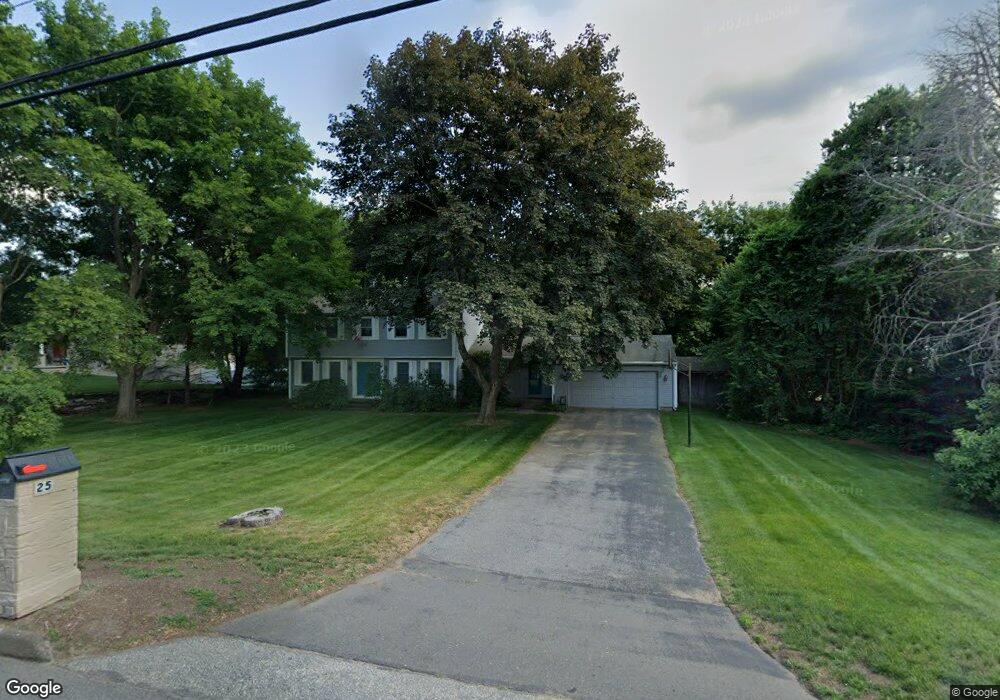
25 Chapin St Ludlow, MA 01056
Estimated Value: $443,289 - $499,000
4
Beds
2
Baths
2,002
Sq Ft
$232/Sq Ft
Est. Value
About This Home
This home is located at 25 Chapin St, Ludlow, MA 01056 and is currently estimated at $464,072, approximately $231 per square foot. 25 Chapin St is a home located in Hampden County with nearby schools including East Street Elementary School, Chapin Street Elementary School, and Paul R. Baird Middle School.
Ownership History
Date
Name
Owned For
Owner Type
Purchase Details
Closed on
Apr 28, 2017
Sold by
Brodeur Philip W and Brodeur Rosemary P
Bought by
Brodeur Philip W
Current Estimated Value
Purchase Details
Closed on
Feb 16, 2017
Sold by
Brodeur Philip and Brodeur Rosemary
Bought by
Brodeur Philip
Purchase Details
Closed on
Sep 12, 1975
Bought by
Brodeur Philip W and Brodeur Rosemary P
Create a Home Valuation Report for This Property
The Home Valuation Report is an in-depth analysis detailing your home's value as well as a comparison with similar homes in the area
Home Values in the Area
Average Home Value in this Area
Purchase History
| Date | Buyer | Sale Price | Title Company |
|---|---|---|---|
| Brodeur Philip W | -- | -- | |
| Brodeur Philip W | -- | -- | |
| Brodeur Philip | -- | -- | |
| Brodeur Philip | -- | -- | |
| Brodeur Philip W | -- | -- |
Source: Public Records
Mortgage History
| Date | Status | Borrower | Loan Amount |
|---|---|---|---|
| Previous Owner | Brodeur Philip W | $34,000 |
Source: Public Records
Tax History
| Year | Tax Paid | Tax Assessment Tax Assessment Total Assessment is a certain percentage of the fair market value that is determined by local assessors to be the total taxable value of land and additions on the property. | Land | Improvement |
|---|---|---|---|---|
| 2025 | $6,400 | $368,900 | $75,300 | $293,600 |
| 2024 | $6,151 | $340,000 | $75,300 | $264,700 |
| 2023 | $5,956 | $305,300 | $62,600 | $242,700 |
| 2022 | $5,089 | $254,600 | $62,600 | $192,000 |
| 2021 | $5,118 | $242,800 | $62,600 | $180,200 |
| 2020 | $4,951 | $240,100 | $61,700 | $178,400 |
| 2019 | $4,701 | $237,200 | $61,100 | $176,100 |
| 2018 | $4,429 | $233,000 | $61,100 | $171,900 |
| 2017 | $4,349 | $234,700 | $62,200 | $172,500 |
| 2016 | $4,311 | $237,800 | $60,900 | $176,900 |
| 2015 | $4,080 | $236,000 | $60,300 | $175,700 |
Source: Public Records
Map
Nearby Homes
- 16 Maple St
- 36 Maple St
- 37 Balsam Hill Rd
- 22 Balsam Hill Rd
- 229 Miller St Unit F-13
- 229 Miller St Unit C-1
- 229 Miller St Unit G-3
- 2 Vista Rd
- 67 Hill Terrace
- Lot 88 Turning Leaf Equinox Pass
- 35 Lake Dr
- 4 Hillcrest Dr
- 38 King Dr
- 1 Aspen Dr
- 1172 East St
- 308 Miller St Unit 32
- 308 Miller St Unit 79
- 308 Miller St Unit 78
- 28 Miller St
- 3076 Boston Rd
Your Personal Tour Guide
Ask me questions while you tour the home.