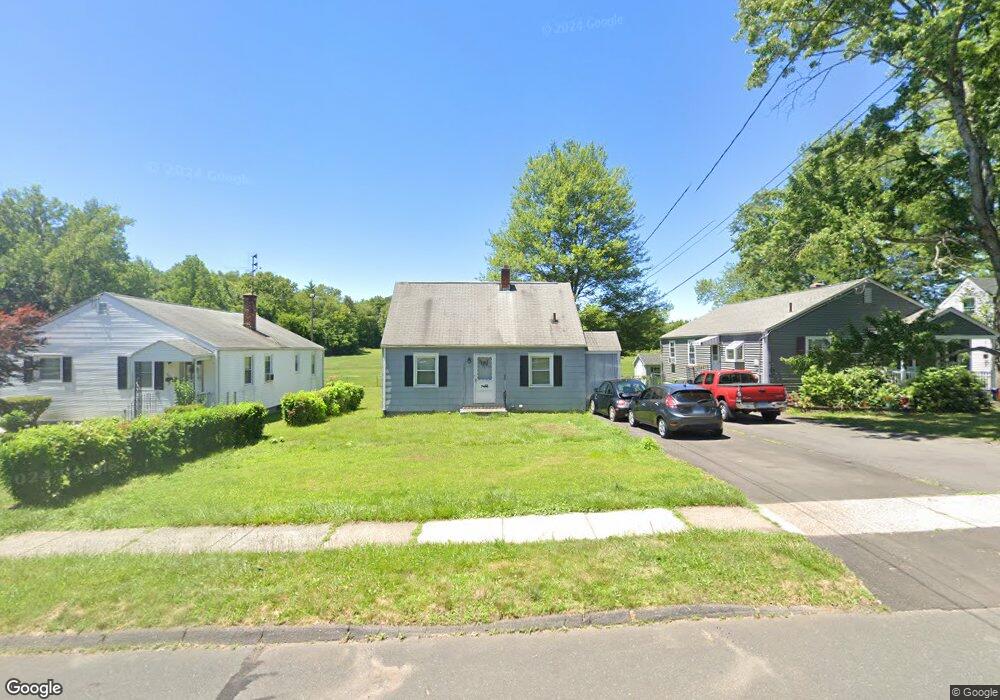
25 Clover St Windsor, CT 06095
Estimated Value: $258,000 - $289,000
4
Beds
2
Baths
941
Sq Ft
$291/Sq Ft
Est. Value
About This Home
This home is located at 25 Clover St, Windsor, CT 06095 and is currently estimated at $274,078, approximately $291 per square foot. 25 Clover St is a home located in Hartford County with nearby schools including Poquonock Elementary School, Clover Street School, and Sage Park Middle School.
Ownership History
Date
Name
Owned For
Owner Type
Purchase Details
Closed on
Oct 30, 1992
Sold by
Eberle Hugh and Eberle Maria
Bought by
Richardson Ervin and Richardson Jeanette
Current Estimated Value
Purchase Details
Closed on
Mar 27, 1987
Sold by
Gardner David
Bought by
Perciballi-Cherle M
Home Financials for this Owner
Home Financials are based on the most recent Mortgage that was taken out on this home.
Original Mortgage
$100,000
Interest Rate
9.03%
Mortgage Type
VA
Create a Home Valuation Report for This Property
The Home Valuation Report is an in-depth analysis detailing your home's value as well as a comparison with similar homes in the area
Home Values in the Area
Average Home Value in this Area
Purchase History
| Date | Buyer | Sale Price | Title Company |
|---|---|---|---|
| Richardson Ervin | $97,325 | -- | |
| Perciballi-Cherle M | $107,500 | -- |
Source: Public Records
Mortgage History
| Date | Status | Borrower | Loan Amount |
|---|---|---|---|
| Previous Owner | Perciballi-Cherle M | $100,000 | |
| Previous Owner | Perciballi-Cherle M | $30,000 |
Source: Public Records
Tax History Compared to Growth
Tax History
| Year | Tax Paid | Tax Assessment Tax Assessment Total Assessment is a certain percentage of the fair market value that is determined by local assessors to be the total taxable value of land and additions on the property. | Land | Improvement |
|---|---|---|---|---|
| 2025 | $3,911 | $137,480 | $45,360 | $92,120 |
| 2024 | $4,168 | $137,480 | $45,360 | $92,120 |
| 2023 | $2,707 | $80,570 | $32,480 | $48,090 |
| 2022 | $2,681 | $80,570 | $32,480 | $48,090 |
| 2021 | $2,681 | $80,570 | $32,480 | $48,090 |
| 2020 | $2,668 | $80,570 | $32,480 | $48,090 |
| 2019 | $2,609 | $80,570 | $32,480 | $48,090 |
| 2018 | $2,674 | $81,130 | $32,480 | $48,650 |
| 2017 | $2,633 | $81,130 | $32,480 | $48,650 |
| 2016 | $2,557 | $81,130 | $32,480 | $48,650 |
| 2015 | $2,509 | $81,130 | $32,480 | $48,650 |
| 2014 | $2,472 | $81,130 | $32,480 | $48,650 |
Source: Public Records
Map
Nearby Homes