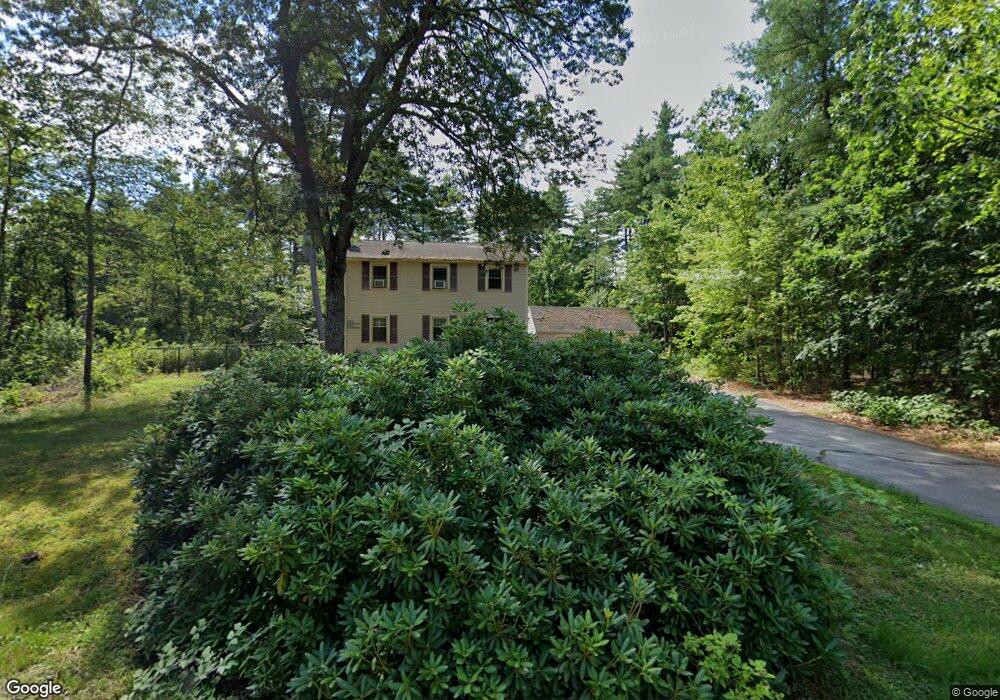
25 Cross Rd Amherst, NH 03031
Estimated Value: $525,611 - $600,000
3
Beds
2
Baths
1,560
Sq Ft
$353/Sq Ft
Est. Value
About This Home
This home is located at 25 Cross Rd, Amherst, NH 03031 and is currently estimated at $551,403, approximately $353 per square foot. 25 Cross Rd is a home located in Hillsborough County with nearby schools including Wilkins Elementary School, Amherst Middle School, and Souhegan Cooperative High School.
Ownership History
Date
Name
Owned For
Owner Type
Purchase Details
Closed on
Apr 13, 2020
Sold by
Sousa Margaret M
Bought by
Sousa Margaret M and Sousa Michelle
Current Estimated Value
Purchase Details
Closed on
Nov 25, 2008
Sold by
Harper Christine M
Bought by
Sousa Margaret M
Home Financials for this Owner
Home Financials are based on the most recent Mortgage that was taken out on this home.
Original Mortgage
$246,642
Interest Rate
6.03%
Mortgage Type
Purchase Money Mortgage
Purchase Details
Closed on
Jun 27, 1996
Sold by
Vear Prop1 Llc
Bought by
Mclaughlin Steven L and Mclaughlin Christine M
Home Financials for this Owner
Home Financials are based on the most recent Mortgage that was taken out on this home.
Original Mortgage
$128,650
Interest Rate
8.05%
Create a Home Valuation Report for This Property
The Home Valuation Report is an in-depth analysis detailing your home's value as well as a comparison with similar homes in the area
Home Values in the Area
Average Home Value in this Area
Purchase History
| Date | Buyer | Sale Price | Title Company |
|---|---|---|---|
| Sousa Margaret M | -- | None Available | |
| Sousa Margaret M | $248,000 | -- | |
| Mclaughlin Steven L | $129,900 | -- |
Source: Public Records
Mortgage History
| Date | Status | Borrower | Loan Amount |
|---|---|---|---|
| Previous Owner | Mclaughlin Steven L | $246,642 | |
| Previous Owner | Mclaughlin Steven L | $100,000 | |
| Previous Owner | Mclaughlin Steven L | $128,650 |
Source: Public Records
Tax History
| Year | Tax Paid | Tax Assessment Tax Assessment Total Assessment is a certain percentage of the fair market value that is determined by local assessors to be the total taxable value of land and additions on the property. | Land | Improvement |
|---|---|---|---|---|
| 2024 | $7,771 | $338,900 | $132,500 | $206,400 |
| 2023 | $7,415 | $338,900 | $132,500 | $206,400 |
| 2022 | $7,159 | $338,800 | $132,500 | $206,300 |
| 2021 | $7,220 | $338,800 | $132,500 | $206,300 |
| 2020 | $6,841 | $240,200 | $106,000 | $134,200 |
| 2019 | $6,522 | $241,900 | $106,000 | $135,900 |
| 2018 | $6,587 | $241,900 | $106,000 | $135,900 |
| 2017 | $6,292 | $241,900 | $106,000 | $135,900 |
| 2016 | $6,072 | $241,900 | $106,000 | $135,900 |
| 2015 | $6,059 | $228,800 | $109,100 | $119,700 |
| 2014 | $6,100 | $228,800 | $109,100 | $119,700 |
| 2013 | $6,052 | $228,800 | $109,100 | $119,700 |
Source: Public Records
Map
Nearby Homes
- 464 Boston Post Rd Unit 5
- 101-2 Seaverns Bridge Rd
- 101 Seaverns Bridge Rd
- 103 Seaverns Bridge Rd
- 105 Seaverns Bridge Rd
- 1 County Rd
- 148 County Rd
- 150 County Rd Unit 4-142-8
- 150 County Rd
- 5 Monticello Dr
- 1 Whitetail Way
- 1 Patricia Ln
- 8 Standish Way Unit 8
- 15 Martingale Rd
- 447 Silver Lake Rd Unit B
- 163 Stable Rd
- 43 Alsun Dr
- 1A Debbie Ln
- 6 Knights Bridge Dr Unit J101
- 30 Pond Parish Rd
Your Personal Tour Guide
Ask me questions while you tour the home.