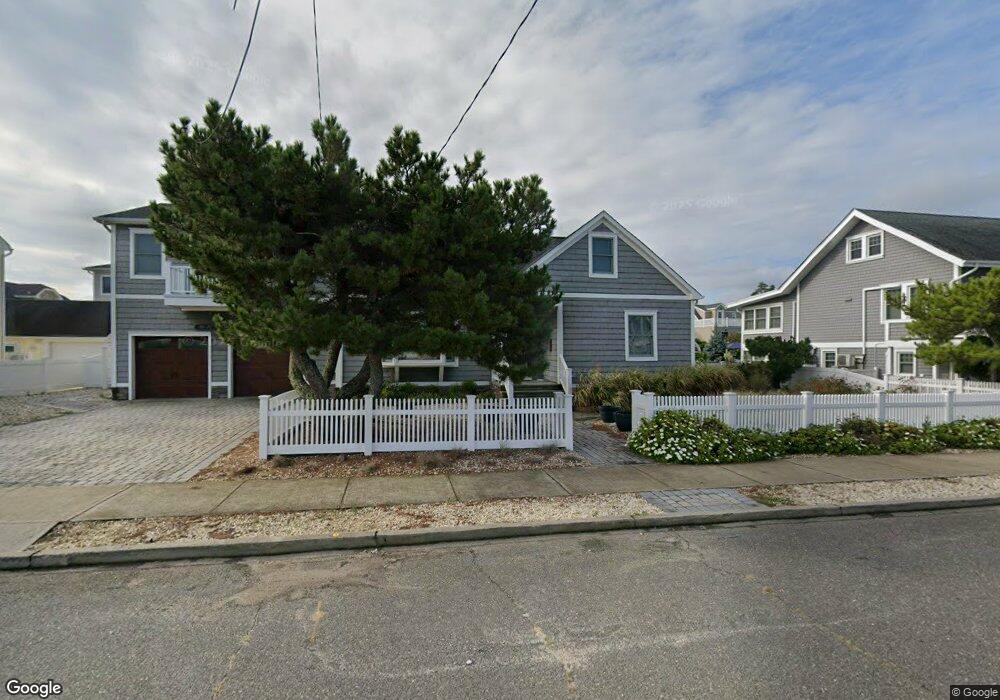
25 D St Seaside Park, NJ 08752
Estimated Value: $1,238,000 - $1,823,000
4
Beds
3
Baths
2,814
Sq Ft
$562/Sq Ft
Est. Value
About This Home
This home is located at 25 D St, Seaside Park, NJ 08752 and is currently estimated at $1,582,295, approximately $562 per square foot. 25 D St is a home located in Ocean County with nearby schools including Central Regional Middle School and Central Regional High School.
Ownership History
Date
Name
Owned For
Owner Type
Purchase Details
Closed on
Jun 3, 2024
Sold by
Kavanaugh Peter and Ryan Edward Peter
Bought by
Ryan Peter K and Kavanaugh Peter
Current Estimated Value
Purchase Details
Closed on
Jun 6, 2023
Sold by
Ryan Peter Kavanaugh and Ryan Carol L
Bought by
Ryan E Peter
Purchase Details
Closed on
Mar 3, 2006
Sold by
Trano Lucy and Antonucci Lucia
Bought by
Trano Lucy
Home Financials for this Owner
Home Financials are based on the most recent Mortgage that was taken out on this home.
Original Mortgage
$348,500
Interest Rate
10.4%
Mortgage Type
New Conventional
Purchase Details
Closed on
Mar 1, 2001
Create a Home Valuation Report for This Property
The Home Valuation Report is an in-depth analysis detailing your home's value as well as a comparison with similar homes in the area
Home Values in the Area
Average Home Value in this Area
Purchase History
| Date | Buyer | Sale Price | Title Company |
|---|---|---|---|
| Ryan Peter K | -- | None Listed On Document | |
| Ryan Peter K | -- | None Listed On Document | |
| Ryan E Peter | -- | None Listed On Document | |
| Trano Lucy | -- | Commonwealth Bergen Title Ag | |
| -- | -- | -- |
Source: Public Records
Mortgage History
| Date | Status | Borrower | Loan Amount |
|---|---|---|---|
| Previous Owner | Trano Lucy | $348,500 |
Source: Public Records
Tax History Compared to Growth
Tax History
| Year | Tax Paid | Tax Assessment Tax Assessment Total Assessment is a certain percentage of the fair market value that is determined by local assessors to be the total taxable value of land and additions on the property. | Land | Improvement |
|---|---|---|---|---|
| 2025 | $15,383 | $940,300 | $700,000 | $240,300 |
| 2024 | $15,129 | $940,300 | $700,000 | $240,300 |
| 2023 | $14,593 | $940,300 | $700,000 | $240,300 |
| 2022 | $14,593 | $940,300 | $700,000 | $240,300 |
| 2021 | $14,283 | $940,300 | $700,000 | $240,300 |
| 2020 | $14,133 | $940,300 | $700,000 | $240,300 |
| 2019 | $13,982 | $940,300 | $700,000 | $240,300 |
| 2018 | $13,070 | $940,300 | $700,000 | $240,300 |
| 2017 | $13,268 | $940,300 | $700,000 | $240,300 |
| 2016 | $11,119 | $847,500 | $700,000 | $147,500 |
| 2015 | $11,602 | $847,500 | $700,000 | $147,500 |
| 2014 | $11,085 | $847,500 | $700,000 | $147,500 |
Source: Public Records
Map
Nearby Homes