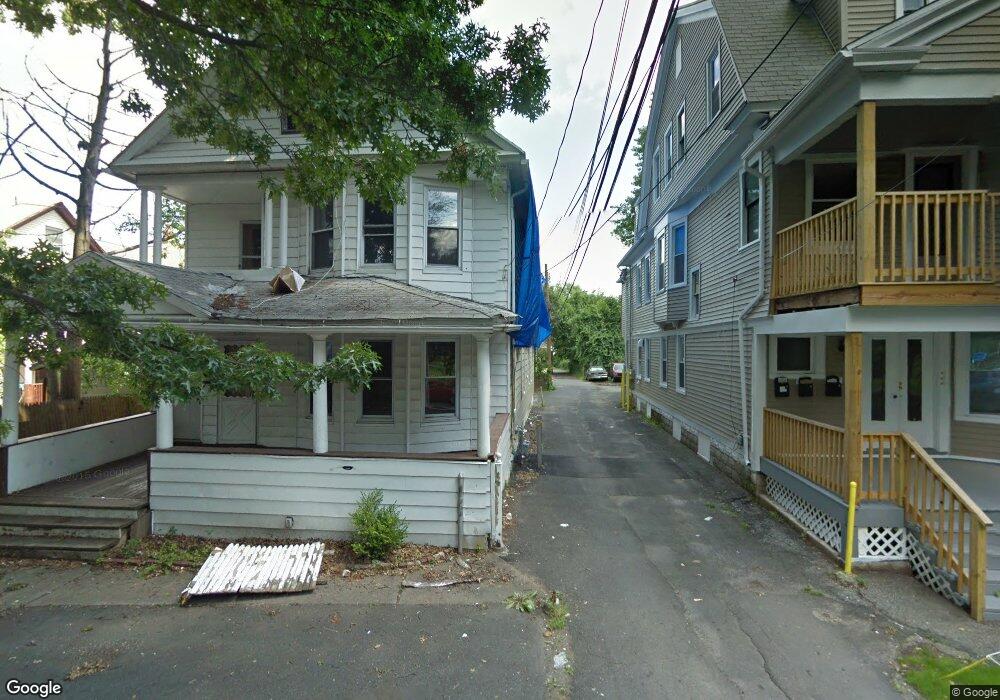
25 Dewey Ct Bridgeport, CT 06605
West End-West Side NeighborhoodEstimated Value: $351,899 - $530,000
7
Beds
3
Baths
2,471
Sq Ft
$183/Sq Ft
Est. Value
About This Home
This home is located at 25 Dewey Ct, Bridgeport, CT 06605 and is currently estimated at $452,725, approximately $183 per square foot. 25 Dewey Ct is a home located in Fairfield County with nearby schools including Bryant Elementary School, Bassick High School, and Park City Prep Charter School.
Ownership History
Date
Name
Owned For
Owner Type
Purchase Details
Closed on
Nov 10, 2010
Sold by
Oas Props Llc
Bought by
Routchier Mark
Current Estimated Value
Home Financials for this Owner
Home Financials are based on the most recent Mortgage that was taken out on this home.
Original Mortgage
$185,183
Outstanding Balance
$122,678
Interest Rate
4.35%
Estimated Equity
$330,047
Purchase Details
Closed on
Mar 3, 2010
Sold by
Deutsche Bank Natl T C
Bought by
Oas Properties Llc
Purchase Details
Closed on
Feb 1, 2010
Sold by
Tafolla Miguel
Bought by
Deutsche Bk
Purchase Details
Closed on
Aug 30, 2007
Sold by
Thieu Nghia
Bought by
Tafolla Miguel
Purchase Details
Closed on
Apr 29, 1998
Sold by
Ianus Dinca and Ianus Nicolae
Bought by
Thiew Nghia T
Purchase Details
Closed on
Jul 23, 1997
Sold by
Cerreta Muriel and Wilson Alfred R
Bought by
Ianus Dinca and Ianus Nicolae
Create a Home Valuation Report for This Property
The Home Valuation Report is an in-depth analysis detailing your home's value as well as a comparison with similar homes in the area
Home Values in the Area
Average Home Value in this Area
Purchase History
| Date | Buyer | Sale Price | Title Company |
|---|---|---|---|
| Routchier Mark | $190,000 | -- | |
| Routchier Mark | $190,000 | -- | |
| Oas Properties Llc | $43,000 | -- | |
| Oas Properties Llc | $43,000 | -- | |
| Deutsche Bk | -- | -- | |
| Deutsche Bk | -- | -- | |
| Tafolla Miguel | $240,000 | -- | |
| Tafolla Miguel | $240,000 | -- | |
| Thiew Nghia T | $68,000 | -- | |
| Thiew Nghia T | $68,000 | -- | |
| Ianus Dinca | $42,000 | -- | |
| Ianus Dinca | $42,000 | -- |
Source: Public Records
Mortgage History
| Date | Status | Borrower | Loan Amount |
|---|---|---|---|
| Open | Ianus Dinca | $185,183 | |
| Closed | Ianus Dinca | $185,183 |
Source: Public Records
Tax History Compared to Growth
Tax History
| Year | Tax Paid | Tax Assessment Tax Assessment Total Assessment is a certain percentage of the fair market value that is determined by local assessors to be the total taxable value of land and additions on the property. | Land | Improvement |
|---|---|---|---|---|
| 2025 | $5,590 | $128,665 | $37,675 | $90,990 |
| 2024 | $5,590 | $128,665 | $37,675 | $90,990 |
| 2023 | $5,590 | $128,665 | $37,675 | $90,990 |
| 2022 | $5,590 | $128,665 | $37,675 | $90,990 |
| 2021 | $5,590 | $128,665 | $37,675 | $90,990 |
| 2020 | $5,314 | $98,430 | $22,840 | $75,590 |
| 2019 | $5,314 | $98,430 | $22,840 | $75,590 |
| 2018 | $5,352 | $98,430 | $22,840 | $75,590 |
| 2017 | $5,352 | $98,430 | $22,840 | $75,590 |
| 2016 | $5,352 | $98,430 | $22,840 | $75,590 |
| 2015 | $5,689 | $134,820 | $34,550 | $100,270 |
| 2014 | $5,689 | $134,820 | $34,550 | $100,270 |
Source: Public Records
Map
Nearby Homes
- 725 Beechwood Ave Unit 727
- 74 Carleton Ave
- 2612 North Ave Unit E2
- 2612 North Ave Unit C1
- 25 Cartright St Unit 5D
- 500 Dewey St
- 368 Lenox Ave
- 80 Cartright St Unit 5D
- 80 Cartright St Unit 8J
- 80 Cartright St Unit 2F
- 80 Cartright St Unit GC
- 80 Cartright St Unit 8B
- 2370 North Ave Unit 4C
- 2370 North Ave Unit 12G
- 2370 North Ave Unit 3F
- 2660 North Ave Unit 217
- 255 Poplar St
- 1059 Hancock Ave Unit 1061
- 1050 Hancock Ave Unit 1052
- 246 Lenox Ave
- 436 Poplar St
- 1275 Howard Ave
- 19 Dewey Ct Unit 2
- 19 Dewey Ct
- 1259 Howard Ave
- 1257 Howard Ave
- 442 Poplar St
- 1287 Howard Ave Unit 1289
- 1289 Howard Ave Unit 1
- 1287 Howard Ave Unit 1
- 1273 Howard Ave Unit 1275
- 448 Poplar St
- 448 Poplar St Unit 1
- 448 Poplar St Unit 2
- 444 Poplar St
- 440 Poplar St
- 1276 Howard Ave
- 1281 Howard Ave
- 462 Poplar St
- 462 Poplar St Unit 1