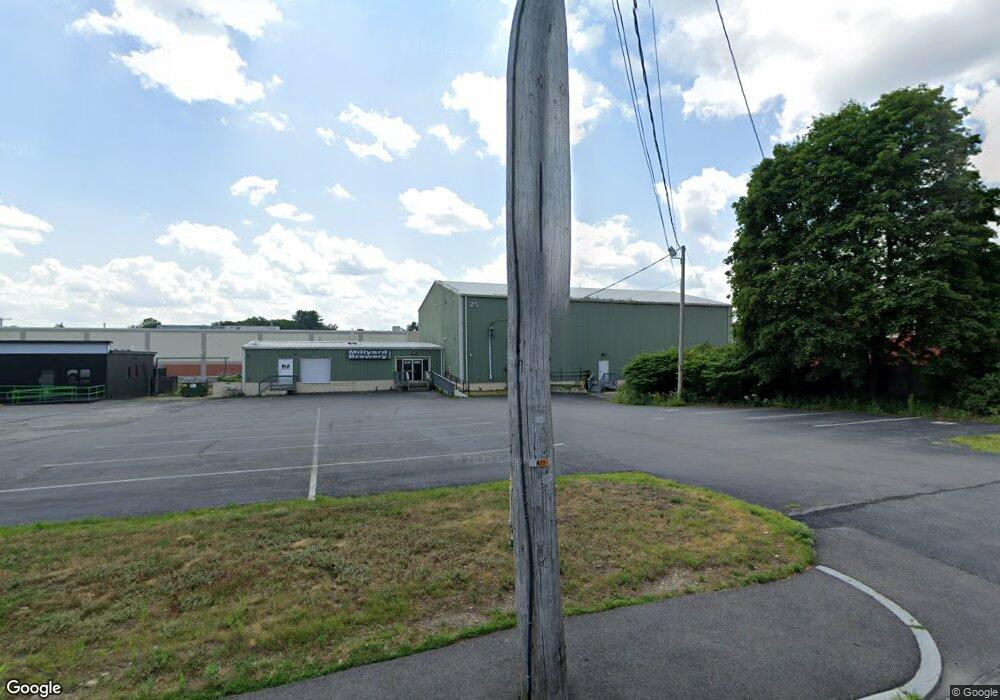
25 E Otterson St Nashua, NH 03060
Downtown Nashua Neighborhood
--
Bed
--
Bath
8,636
Sq Ft
0.9
Acres
About This Home
This home is located at 25 E Otterson St, Nashua, NH 03060. 25 E Otterson St is a home located in Hillsborough County with nearby schools including Dr. Norman W. Crisp Elementary School, Elm Street Middle School, and Nashua High School North.
Ownership History
Date
Name
Owned For
Owner Type
Purchase Details
Closed on
Dec 30, 2021
Sold by
East Otterson Prop Llc
Bought by
Bel Aire & Reyem Llc
Home Financials for this Owner
Home Financials are based on the most recent Mortgage that was taken out on this home.
Original Mortgage
$310,500
Outstanding Balance
$285,579
Interest Rate
3.11%
Mortgage Type
Purchase Money Mortgage
Purchase Details
Closed on
Mar 14, 2019
Sold by
Cul De Sac Ltd
Bought by
East Otterson Properties
Home Financials for this Owner
Home Financials are based on the most recent Mortgage that was taken out on this home.
Original Mortgage
$600,000
Interest Rate
4.4%
Mortgage Type
Purchase Money Mortgage
Create a Home Valuation Report for This Property
The Home Valuation Report is an in-depth analysis detailing your home's value as well as a comparison with similar homes in the area
Home Values in the Area
Average Home Value in this Area
Purchase History
| Date | Buyer | Sale Price | Title Company |
|---|---|---|---|
| Bel Aire & Reyem Llc | $300,000 | None Available | |
| East Otterson Properties | $750,000 | -- |
Source: Public Records
Mortgage History
| Date | Status | Borrower | Loan Amount |
|---|---|---|---|
| Open | Bel Aire & Reyem Llc | $310,500 | |
| Previous Owner | East Otterson Properties | $600,000 |
Source: Public Records
Tax History Compared to Growth
Tax History
| Year | Tax Paid | Tax Assessment Tax Assessment Total Assessment is a certain percentage of the fair market value that is determined by local assessors to be the total taxable value of land and additions on the property. | Land | Improvement |
|---|---|---|---|---|
| 2024 | $16,439 | $1,033,900 | $109,900 | $924,000 |
| 2023 | $17,853 | $979,300 | $95,700 | $883,600 |
| 2022 | $17,696 | $979,300 | $95,700 | $883,600 |
| 2021 | $19,684 | $847,700 | $159,500 | $688,200 |
| 2020 | $19,166 | $847,700 | $159,500 | $688,200 |
| 2019 | $18,446 | $847,700 | $159,500 | $688,200 |
| 2018 | $17,980 | $847,700 | $159,500 | $688,200 |
| 2017 | $18,822 | $729,800 | $200,700 | $529,100 |
| 2016 | $18,682 | $745,200 | $200,700 | $544,500 |
| 2015 | $18,280 | $745,200 | $200,700 | $544,500 |
| 2014 | $17,807 | $740,400 | $200,700 | $539,700 |
Source: Public Records
Map
Nearby Homes
- 24 E Otterson St
- 4 Haines St Unit 56
- 4 1/2 Haines St
- 13 Mulvanity St
- 8 Buck St Unit 10
- 19 King St Unit 87
- 15 Lovell St Unit 20
- 15 Lovell St Unit 3
- 15 Lovell St Unit 10
- 71 Vine St Unit 713/4
- 1 Circle Ave
- 121 Palm St
- 41-43 Williams St
- 29 Wilder St
- 10 Zellwood St
- 38 Central St
- 63 Taylor St
- 30 Ledge St
- 4 Badger St
- 52 Main St Unit 402