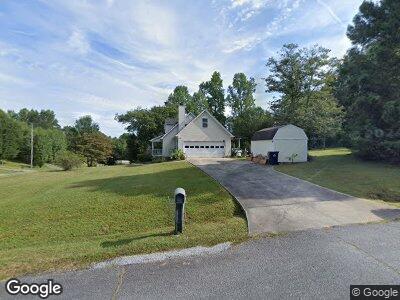
25 Evergreen Ct Dahlonega, GA 30533
Estimated Value: $330,000 - $356,000
--
Bed
3
Baths
1,623
Sq Ft
$212/Sq Ft
Est. Value
About This Home
This home is located at 25 Evergreen Ct, Dahlonega, GA 30533 and is currently estimated at $344,875, approximately $212 per square foot. 25 Evergreen Ct is a home located in Lumpkin County with nearby schools including Lumpkin County High School.
Ownership History
Date
Name
Owned For
Owner Type
Purchase Details
Closed on
Feb 7, 2006
Sold by
Not Provided
Bought by
Vanbibber Susan Lynn
Current Estimated Value
Home Financials for this Owner
Home Financials are based on the most recent Mortgage that was taken out on this home.
Original Mortgage
$112,000
Outstanding Balance
$64,376
Interest Rate
6.08%
Mortgage Type
New Conventional
Estimated Equity
$280,499
Purchase Details
Closed on
Oct 4, 2005
Sold by
Daigle Kim T
Bought by
Household Realty Corp
Purchase Details
Closed on
May 31, 2001
Sold by
Dahlonega Builders
Bought by
Daigle Kim T and Daigle Mark A
Purchase Details
Closed on
Dec 11, 2000
Bought by
Parks C Steve
Purchase Details
Closed on
Jul 19, 2000
Sold by
Eads Tami
Bought by
Dahlonega Builders I
Purchase Details
Closed on
Jul 18, 2000
Sold by
Eads Michael
Bought by
Eads Tami
Purchase Details
Closed on
Sep 14, 1995
Sold by
Parks C Steve
Bought by
Brookshire Horace
Purchase Details
Closed on
Aug 17, 1995
Sold by
Brookshire Horace
Bought by
Eads Michael
Create a Home Valuation Report for This Property
The Home Valuation Report is an in-depth analysis detailing your home's value as well as a comparison with similar homes in the area
Home Values in the Area
Average Home Value in this Area
Purchase History
| Date | Buyer | Sale Price | Title Company |
|---|---|---|---|
| Vanbibber Susan Lynn | $140,000 | -- | |
| Household Realty Corp | $131,100 | -- | |
| Daigle Kim T | $136,000 | -- | |
| Parks C Steve | -- | -- | |
| Dahlonega Builders I | $115,000 | -- | |
| Eads Tami | -- | -- | |
| Brookshire Horace | -- | -- | |
| Eads Michael | $8,500 | -- |
Source: Public Records
Mortgage History
| Date | Status | Borrower | Loan Amount |
|---|---|---|---|
| Open | Hardman Bill T | $75,000 | |
| Open | Vanbibber Susan Lynn | $112,000 | |
| Closed | Vanbibber Susan Lynn | $28,000 |
Source: Public Records
Tax History Compared to Growth
Tax History
| Year | Tax Paid | Tax Assessment Tax Assessment Total Assessment is a certain percentage of the fair market value that is determined by local assessors to be the total taxable value of land and additions on the property. | Land | Improvement |
|---|---|---|---|---|
| 2024 | $2,402 | $102,114 | $12,000 | $90,114 |
| 2023 | $2,251 | $95,690 | $12,000 | $83,690 |
| 2022 | $1,988 | $80,281 | $12,000 | $68,281 |
| 2021 | $1,636 | $63,910 | $8,000 | $55,910 |
| 2020 | $1,642 | $62,227 | $8,000 | $54,227 |
| 2019 | $1,657 | $62,227 | $8,000 | $54,227 |
| 2018 | $1,575 | $55,515 | $8,000 | $47,515 |
| 2017 | $1,529 | $52,871 | $8,000 | $44,871 |
| 2016 | $1,394 | $46,598 | $6,000 | $40,598 |
| 2015 | $1,241 | $46,598 | $6,000 | $40,598 |
| 2014 | $1,241 | $47,082 | $6,000 | $41,082 |
| 2013 | -- | $48,048 | $6,000 | $42,048 |
Source: Public Records
Map
Nearby Homes
- 1011 Gold Ridge Rd
- 6292 Timber Creek Trail
- 71 Parks Place
- 6202 Stowers Rd
- 6462 Old Dahlonega Hwy
- 516 Martin Byers Rd
- 6439 S Chestatee
- 167 Old Leathers Ford Rd
- 300 Elliots Ln
- 6266 Yellow Creek Rd
- 6251 Yellow Creek Rd
- 6453 Claude Parks Rd
- 5781 Thompson Bridge Rd
- 180 Buckeye Ridge E
- 356 Hickory Springs Dr
- 68 Flynt Ridge Dr
- 6249 Ben Parks Rd
- 25 Evergreen Ct
- 34 Bridgestone Way
- 316 Pinewood Place
- 365 Pinewood Place
- 301 Pinewood Place
- 77 Evergreen Ct
- 50 Evergreen Ct
- 76 Bridgestone Way
- 27 Bridgestone Way
- 280 Pinewood Place
- 289 Pinewood Place
- 91 Evergreen Ct
- 425 Pinewood Place
- 86 Evergreen Ct
- 0 Evergreen Ct Unit 7381410
- 0 Evergreen Ct Unit 7349392
- 0 Evergreen Ct
- 90 Evergreen Ct
- 88 Bridgestone Way
- 139 Bridgestone Way