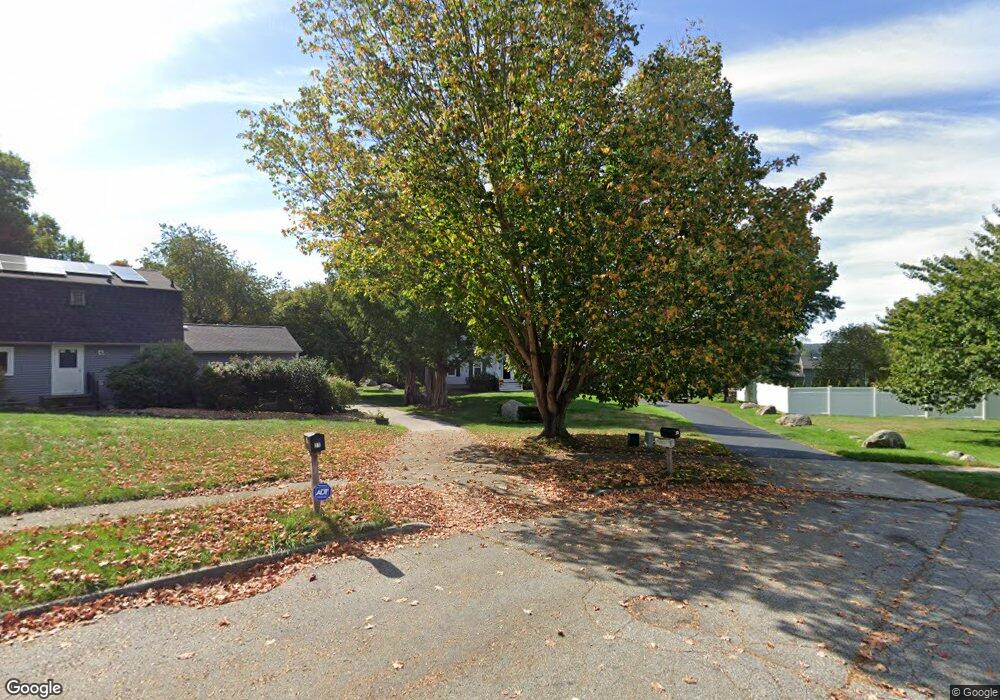
25 Fishers View Dr Groton, CT 06340
Noank NeighborhoodEstimated Value: $746,354 - $903,000
4
Beds
3
Baths
2,592
Sq Ft
$311/Sq Ft
Est. Value
About This Home
This home is located at 25 Fishers View Dr, Groton, CT 06340 and is currently estimated at $806,339, approximately $311 per square foot. 25 Fishers View Dr is a home located in New London County with nearby schools including Groton Middle School and Robert E. Fitch High School.
Ownership History
Date
Name
Owned For
Owner Type
Purchase Details
Closed on
Jun 30, 1998
Sold by
Eno Matthew D and Eno Patricia M
Bought by
Lynch David A and Lynch Marikate A
Current Estimated Value
Purchase Details
Closed on
Apr 1, 1992
Sold by
Szot Daria and Szot Robert
Bought by
Eno Matthew and Eno Patricia
Create a Home Valuation Report for This Property
The Home Valuation Report is an in-depth analysis detailing your home's value as well as a comparison with similar homes in the area
Home Values in the Area
Average Home Value in this Area
Purchase History
| Date | Buyer | Sale Price | Title Company |
|---|---|---|---|
| Lynch David A | $249,000 | -- | |
| Eno Matthew | $193,000 | -- |
Source: Public Records
Mortgage History
| Date | Status | Borrower | Loan Amount |
|---|---|---|---|
| Open | Eno Matthew | $190,000 | |
| Closed | Eno Matthew | $195,000 | |
| Closed | Eno Matthew | $30,000 |
Source: Public Records
Tax History Compared to Growth
Tax History
| Year | Tax Paid | Tax Assessment Tax Assessment Total Assessment is a certain percentage of the fair market value that is determined by local assessors to be the total taxable value of land and additions on the property. | Land | Improvement |
|---|---|---|---|---|
| 2025 | $9,876 | $374,360 | $175,322 | $199,038 |
| 2024 | $9,220 | $374,360 | $175,322 | $199,038 |
| 2023 | $8,839 | $374,360 | $90,020 | $284,340 |
| 2022 | $8,659 | $374,360 | $90,020 | $284,340 |
| 2021 | $7,309 | $264,250 | $66,710 | $197,540 |
| 2020 | $7,122 | $264,250 | $66,710 | $197,540 |
| 2019 | $6,799 | $264,250 | $66,710 | $197,540 |
| 2018 | $6,754 | $264,250 | $66,710 | $197,540 |
| 2017 | $6,638 | $264,250 | $66,710 | $197,540 |
| 2016 | $6,474 | $278,810 | $96,950 | $181,860 |
| 2015 | $6,229 | $278,810 | $96,950 | $181,860 |
| 2014 | $6,070 | $278,810 | $96,950 | $181,860 |
Source: Public Records
Map
Nearby Homes