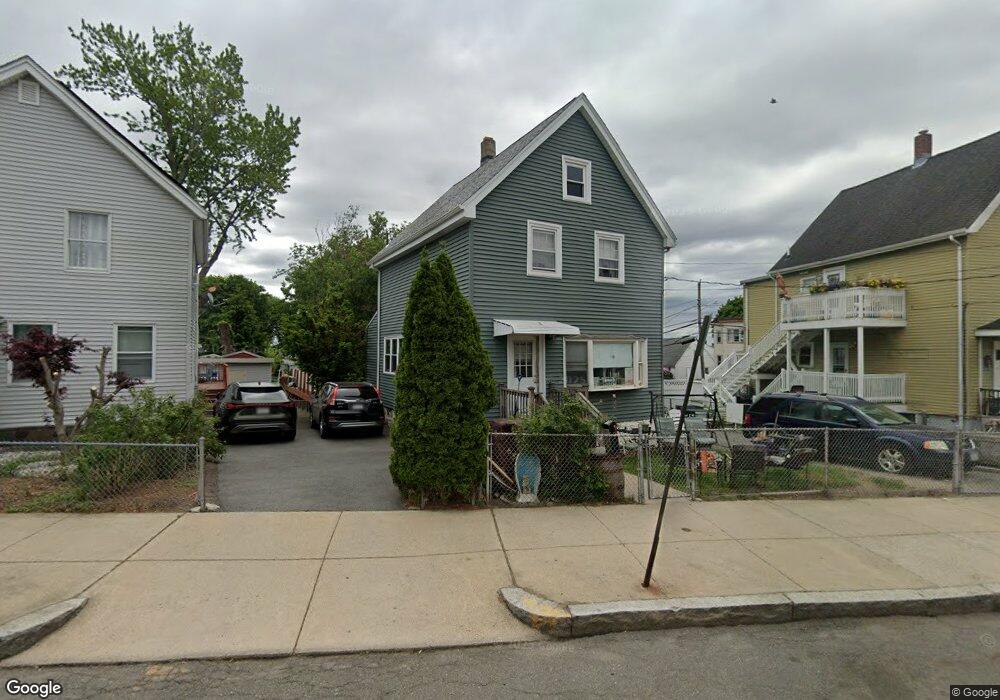
25 Foster St Everett, MA 02149
Glendale NeighborhoodEstimated Value: $551,764 - $594,000
3
Beds
1
Bath
1,224
Sq Ft
$466/Sq Ft
Est. Value
About This Home
This home is located at 25 Foster St, Everett, MA 02149 and is currently estimated at $570,441, approximately $466 per square foot. 25 Foster St is a home located in Middlesex County with nearby schools including Everett High School, Pioneer Charter School of Science, and St Anthony School.
Ownership History
Date
Name
Owned For
Owner Type
Purchase Details
Closed on
Dec 19, 1997
Sold by
Est Gulla Anthony A and Deinnocentis Rose
Bought by
Reis Zeferino M and Reis Hermenia J
Current Estimated Value
Purchase Details
Closed on
Sep 28, 1993
Sold by
Cioffi Enrico A and Cioffi Linda L
Bought by
Kenyon Michael D and Kenyon Kelley J
Home Financials for this Owner
Home Financials are based on the most recent Mortgage that was taken out on this home.
Original Mortgage
$80,750
Interest Rate
7.1%
Mortgage Type
Purchase Money Mortgage
Create a Home Valuation Report for This Property
The Home Valuation Report is an in-depth analysis detailing your home's value as well as a comparison with similar homes in the area
Home Values in the Area
Average Home Value in this Area
Purchase History
| Date | Buyer | Sale Price | Title Company |
|---|---|---|---|
| Reis Zeferino M | $215,000 | -- | |
| Kenyon Michael D | $85,000 | -- |
Source: Public Records
Mortgage History
| Date | Status | Borrower | Loan Amount |
|---|---|---|---|
| Previous Owner | Kenyon Michael D | $80,750 | |
| Previous Owner | Kenyon Michael D | $44,500 |
Source: Public Records
Tax History
| Year | Tax Paid | Tax Assessment Tax Assessment Total Assessment is a certain percentage of the fair market value that is determined by local assessors to be the total taxable value of land and additions on the property. | Land | Improvement |
|---|---|---|---|---|
| 2025 | $5,499 | $482,800 | $210,700 | $272,100 |
| 2024 | $5,176 | $451,700 | $201,600 | $250,100 |
| 2023 | $4,990 | $423,600 | $187,800 | $235,800 |
| 2022 | $4,108 | $396,500 | $178,700 | $217,800 |
| 2021 | $3,612 | $366,000 | $162,600 | $203,400 |
| 2020 | $3,856 | $362,400 | $162,600 | $199,800 |
| 2019 | $4,031 | $325,600 | $151,600 | $174,000 |
| 2018 | $3,632 | $263,600 | $131,900 | $131,700 |
| 2017 | $3,402 | $235,600 | $110,000 | $125,600 |
| 2016 | $3,154 | $218,300 | $110,000 | $108,300 |
| 2015 | $2,941 | $201,300 | $98,300 | $103,000 |
Source: Public Records
Map
Nearby Homes
- 29 Foster St
- 53 Arlington St
- 21 Foster St
- 49 Arlington St
- 31 Foster St
- 50 Villa Ave
- 24 Foster St
- 47 Arlington St
- 20 Foster St
- 48 Villa Ave
- 48 Villa Ave Unit 1
- 11 Foster St Unit 1
- 45 Arlington St
- 52 Arlington St Unit 2
- 16 Foster St
- 44 Villa Ave
- 41 Arlington St
- 56 Arlington St
- 39 Foster St
- 42 Villa Ave
Your Personal Tour Guide
Ask me questions while you tour the home.