25 Franklin St Auburn, MA 01501
Stoneville NeighborhoodEstimated Value: $462,355 - $515,000
3
Beds
3
Baths
1,467
Sq Ft
$338/Sq Ft
Est. Value
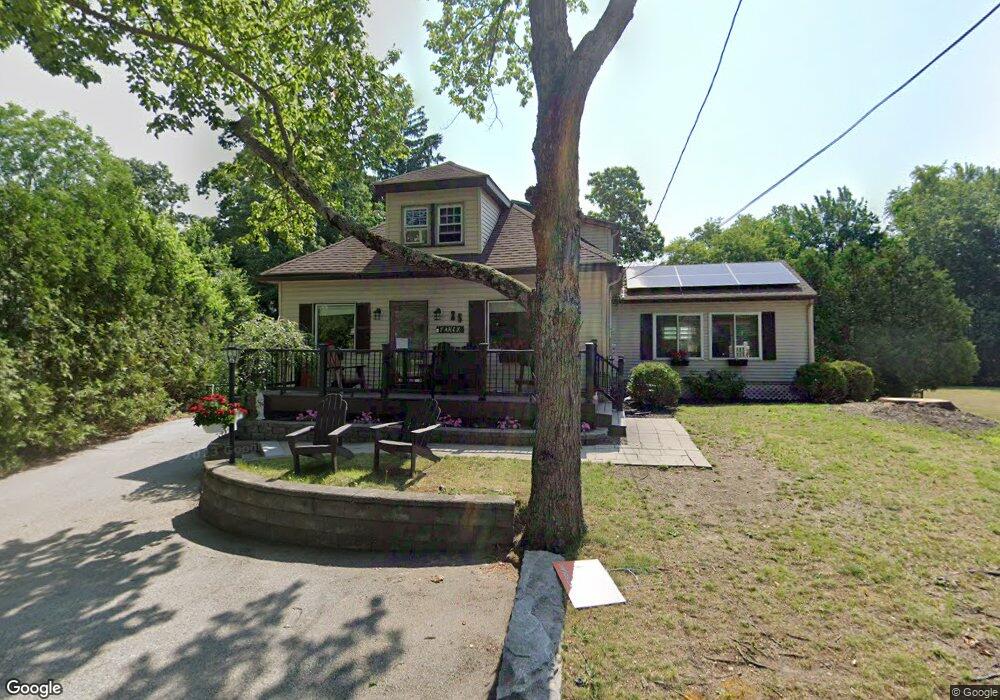
About This Home
This home is located at 25 Franklin St, Auburn, MA 01501 and is currently estimated at $495,339, approximately $337 per square foot. 25 Franklin St is a home located in Worcester County with nearby schools including Auburn Senior High School, Canterbury Street School, and Shrewsbury Montessori School - Auburn Campus.
Ownership History
Date
Name
Owned For
Owner Type
Purchase Details
Closed on
Nov 30, 2004
Sold by
Fahey Joseph F and Fahey Patrick M
Bought by
Fahey Deborah A and Fahey Joseph F
Current Estimated Value
Home Financials for this Owner
Home Financials are based on the most recent Mortgage that was taken out on this home.
Original Mortgage
$45,000
Outstanding Balance
$22,566
Interest Rate
5.75%
Mortgage Type
Purchase Money Mortgage
Estimated Equity
$472,773
Create a Home Valuation Report for This Property
The Home Valuation Report is an in-depth analysis detailing your home's value as well as a comparison with similar homes in the area
Home Values in the Area
Average Home Value in this Area
Purchase History
| Date | Buyer | Sale Price | Title Company |
|---|---|---|---|
| Fahey Deborah A | $100,000 | -- | |
| Fahey Joseph F | -- | -- |
Source: Public Records
Mortgage History
| Date | Status | Borrower | Loan Amount |
|---|---|---|---|
| Open | Fahey Deborah A | $45,000 |
Source: Public Records
Tax History
| Year | Tax Paid | Tax Assessment Tax Assessment Total Assessment is a certain percentage of the fair market value that is determined by local assessors to be the total taxable value of land and additions on the property. | Land | Improvement |
|---|---|---|---|---|
| 2025 | $61 | $424,300 | $115,100 | $309,200 |
| 2024 | $5,954 | $398,800 | $109,700 | $289,100 |
| 2023 | $5,928 | $373,300 | $99,800 | $273,500 |
| 2022 | $5,391 | $320,500 | $99,800 | $220,700 |
| 2021 | $5,040 | $292,400 | $88,000 | $204,400 |
| 2020 | $4,962 | $289,600 | $88,000 | $201,600 |
| 2019 | $4,975 | $270,100 | $87,200 | $182,900 |
| 2018 | $1,172 | $262,500 | $81,500 | $181,000 |
| 2017 | $4,624 | $252,100 | $73,900 | $178,200 |
| 2016 | $4,233 | $234,000 | $77,300 | $156,700 |
| 2015 | $3,854 | $223,300 | $77,300 | $146,000 |
| 2014 | $3,937 | $227,700 | $73,600 | $154,100 |
Source: Public Records
Map
Nearby Homes
- 5 Commonwealth Ave
- 99 Clover St
- 177 Boyce St
- 25 Vinal St Unit 28
- 25 Vinal St Unit 26
- 25 Vinal St Unit 29
- 25 Vinal St Unit 30
- 1 Rockland Road Ct
- 204-212 Hampton St
- 1034 Southbridge St
- 154 Pakachoag St
- 177 Oxford St N
- 31-33 Walsh Ave
- 33 Walsh Ave
- 31 Walsh Ave
- 11 Hulbert Rd Unit 13
- 47 Malvern Rd
- 40 Bryn Mawr Ave
- 19-20 Williams St
- 103 Henshaw St
Your Personal Tour Guide
Ask me questions while you tour the home.