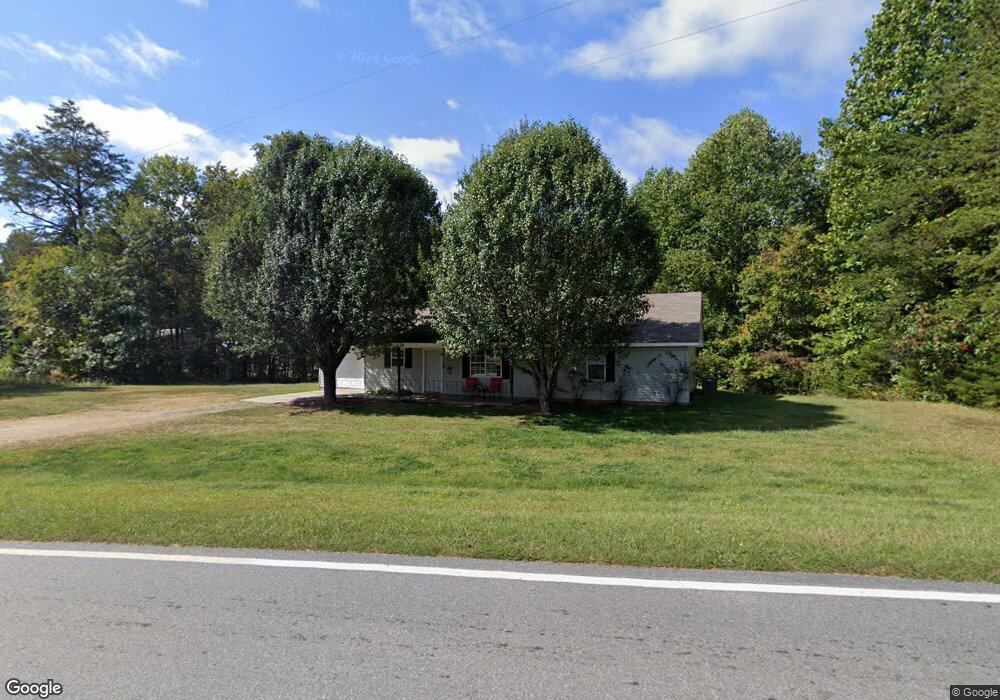
25 Frogtown Rd Dahlonega, GA 30533
Estimated Value: $311,092 - $377,000
3
Beds
2
Baths
--
Sq Ft
1.5
Acres
About This Home
This home is located at 25 Frogtown Rd, Dahlonega, GA 30533 and is currently estimated at $347,023. 25 Frogtown Rd is a home located in Lumpkin County with nearby schools including Clay County Middle School and Lumpkin County High School.
Ownership History
Date
Name
Owned For
Owner Type
Purchase Details
Closed on
Jun 27, 2014
Sold by
Martin Jimmy R
Bought by
Copeland Darren
Current Estimated Value
Purchase Details
Closed on
Dec 7, 2005
Sold by
Copeland Darren
Bought by
Martin Jimmy
Home Financials for this Owner
Home Financials are based on the most recent Mortgage that was taken out on this home.
Original Mortgage
$89,600
Interest Rate
6.29%
Mortgage Type
New Conventional
Purchase Details
Closed on
Nov 3, 2005
Sold by
Jlk Properties Llc
Bought by
Copeland Darren
Home Financials for this Owner
Home Financials are based on the most recent Mortgage that was taken out on this home.
Original Mortgage
$89,600
Interest Rate
6.29%
Mortgage Type
New Conventional
Purchase Details
Closed on
Oct 21, 2003
Sold by
Mortgage Electronic Registrati
Bought by
Jlk Properties
Purchase Details
Closed on
May 7, 2002
Sold by
Massey Earl and Massey Paula
Bought by
Mortgage Electronic Registration System
Purchase Details
Closed on
May 16, 2000
Sold by
Johnson Richard
Bought by
Massey Earl and Massey Paula
Create a Home Valuation Report for This Property
The Home Valuation Report is an in-depth analysis detailing your home's value as well as a comparison with similar homes in the area
Home Values in the Area
Average Home Value in this Area
Purchase History
| Date | Buyer | Sale Price | Title Company |
|---|---|---|---|
| Copeland Darren | -- | -- | |
| Martin Jimmy | -- | -- | |
| Copeland Darren | -- | -- | |
| Copeland Darren | -- | -- | |
| Jlk Properties | $79,500 | -- | |
| Mortgage Electronic Registration System | -- | -- | |
| Massey Earl | $82,000 | -- |
Source: Public Records
Mortgage History
| Date | Status | Borrower | Loan Amount |
|---|---|---|---|
| Previous Owner | Copeland Darren | $89,600 |
Source: Public Records
Tax History Compared to Growth
Tax History
| Year | Tax Paid | Tax Assessment Tax Assessment Total Assessment is a certain percentage of the fair market value that is determined by local assessors to be the total taxable value of land and additions on the property. | Land | Improvement |
|---|---|---|---|---|
| 2024 | $1,831 | $76,207 | $10,920 | $65,287 |
| 2023 | $1,665 | $70,802 | $10,205 | $60,597 |
| 2022 | $1,522 | $61,472 | $8,504 | $52,968 |
| 2021 | $1,331 | $51,996 | $8,504 | $43,492 |
| 2020 | $1,327 | $50,312 | $8,149 | $42,163 |
| 2019 | $1,339 | $50,312 | $8,149 | $42,163 |
| 2018 | $1,287 | $45,356 | $8,149 | $37,207 |
| 2017 | $1,234 | $42,654 | $8,149 | $34,505 |
| 2016 | $1,132 | $37,855 | $8,149 | $29,706 |
| 2015 | $1,007 | $37,855 | $8,149 | $29,706 |
| 2014 | $1,007 | $38,206 | $8,149 | $30,056 |
| 2013 | -- | $38,556 | $8,149 | $30,407 |
Source: Public Records
Map
Nearby Homes
- 1063 Grindle Bridge Rd
- 0 Horseshoe Bend Rd Unit 10571975
- 0 Horseshoe Bend Rd Unit 7620338
- 925 Horseshoe Bend Rd
- 64 Highview Ln
- 349 Hester Rd
- 313 Hester Rd
- 16 Welch Cir
- 651 Hester Rd
- 124 Candy Man Ln
- 0 Stancil Dyer Rd Unit 10640477
- 134 Elkmont Dr
- 133 Elkmont Dr
- 2717 Damascus Church Rd
- 242 Hooper Rd
- 45 Chestatee River Ridge
- 748 Damascus Church Rd
- 412 Fireside Ridge Dr
- 2392 Town Creek Church Rd
- 2067 Town Creek Church Rd
- 0 Frogtown Rd
- 0 Frogtown Rd Unit 2818859
- 0 Frogtown Rd Unit 3247544
- 0 Frogtown Rd Unit 3774752
- 71 Frogtown Rd
- 141 Frogtown Rd
- 145 Frogtown Rd
- 2227 Town Creek Church Rd
- 356 Rivermist Dr
- 2250 Town Creek Church Rd
- 2253 Town Creek Church Rd
- 302 Rivermist Dr
- 1906 Town Creek Church Rd
- 2252 Town Creek Church Rd
- 310 Frogtown Rd
- 31 Hemlock Dr
- 626 Rivermist Dr
- 172 Rivermist Dr