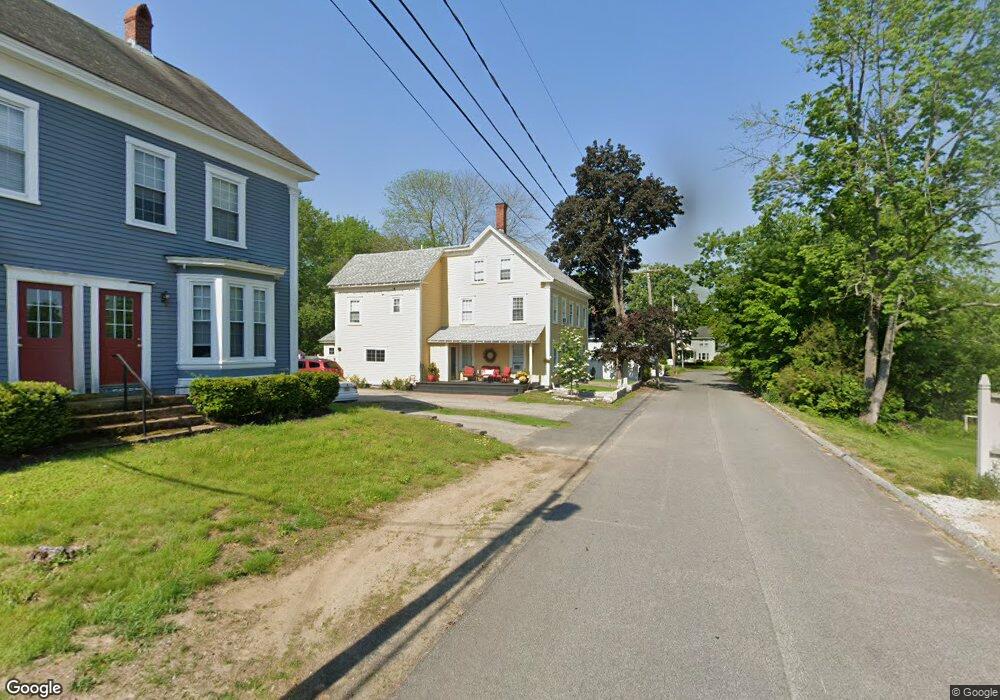
25 Grant St South Berwick, ME 03908
Estimated Value: $526,000 - $685,058
4
Beds
3
Baths
1,632
Sq Ft
$364/Sq Ft
Est. Value
About This Home
This home is located at 25 Grant St, South Berwick, ME 03908 and is currently estimated at $593,265, approximately $363 per square foot. 25 Grant St is a home located in York County with nearby schools including Marshwood High School, Berwick Academy, and Seacoast Christian School.
Ownership History
Date
Name
Owned For
Owner Type
Purchase Details
Closed on
Jun 20, 2007
Sold by
Flynn Ruth S and Flynn 2Nd Timothy J
Bought by
Maldonis Kimberly R and Maldonis Jeffrey S
Current Estimated Value
Home Financials for this Owner
Home Financials are based on the most recent Mortgage that was taken out on this home.
Original Mortgage
$220,000
Interest Rate
6.14%
Mortgage Type
Unknown
Create a Home Valuation Report for This Property
The Home Valuation Report is an in-depth analysis detailing your home's value as well as a comparison with similar homes in the area
Home Values in the Area
Average Home Value in this Area
Purchase History
| Date | Buyer | Sale Price | Title Company |
|---|---|---|---|
| Maldonis Kimberly R | -- | -- |
Source: Public Records
Mortgage History
| Date | Status | Borrower | Loan Amount |
|---|---|---|---|
| Open | Maldonis Kimberly R | $260,000 | |
| Closed | Maldonis Kimberly R | $260,000 | |
| Closed | Maldonis Kimberly R | $220,000 |
Source: Public Records
Tax History Compared to Growth
Tax History
| Year | Tax Paid | Tax Assessment Tax Assessment Total Assessment is a certain percentage of the fair market value that is determined by local assessors to be the total taxable value of land and additions on the property. | Land | Improvement |
|---|---|---|---|---|
| 2024 | $7,502 | $559,000 | $145,000 | $414,000 |
| 2023 | $6,866 | $491,800 | $126,900 | $364,900 |
| 2022 | $6,190 | $425,700 | $120,800 | $304,900 |
| 2021 | $5,913 | $380,500 | $120,800 | $259,700 |
| 2020 | $6,059 | $346,200 | $106,900 | $239,300 |
| 2019 | $6,057 | $322,200 | $97,200 | $225,000 |
| 2018 | $5,946 | $308,100 | $99,800 | $208,300 |
| 2017 | $5,854 | $308,100 | $99,800 | $208,300 |
| 2016 | $5,638 | $308,100 | $99,800 | $208,300 |
| 2015 | $5,484 | $308,100 | $99,800 | $208,300 |
| 2014 | $5,453 | $308,100 | $99,800 | $208,300 |
Source: Public Records
Map
Nearby Homes