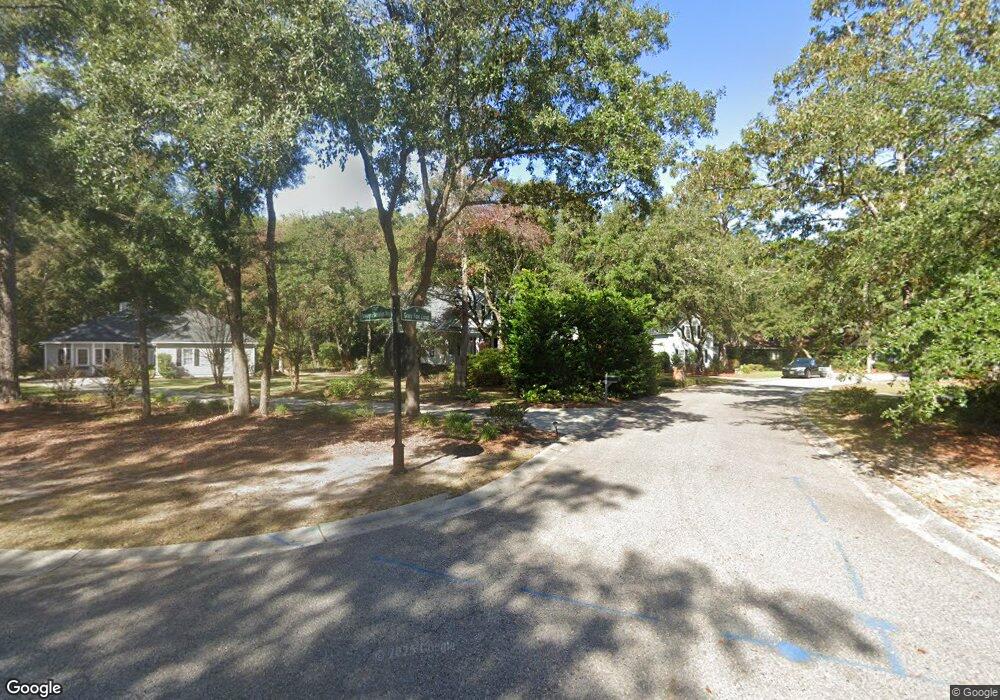
25 Grey Fox Loop Pawleys Island, SC 29585
Estimated Value: $753,000 - $831,000
4
Beds
4
Baths
3,000
Sq Ft
$262/Sq Ft
Est. Value
About This Home
This home is located at 25 Grey Fox Loop, Pawleys Island, SC 29585 and is currently estimated at $786,663, approximately $262 per square foot. 25 Grey Fox Loop is a home located in Georgetown County with nearby schools including Waccamaw Elementary School, Waccamaw Intermediate School, and Waccamaw Middle School.
Ownership History
Date
Name
Owned For
Owner Type
Purchase Details
Closed on
Oct 15, 2011
Sold by
Meyer James L and Meyer Judith V
Bought by
Flathers Richard James and Flathers Vicki Lynn
Current Estimated Value
Home Financials for this Owner
Home Financials are based on the most recent Mortgage that was taken out on this home.
Original Mortgage
$271,200
Outstanding Balance
$186,390
Interest Rate
4.26%
Mortgage Type
New Conventional
Estimated Equity
$600,273
Purchase Details
Closed on
Jul 28, 2005
Sold by
Sparks Gary D and Sparks Melodye P
Bought by
Meyer James L and Meyer Judith
Home Financials for this Owner
Home Financials are based on the most recent Mortgage that was taken out on this home.
Original Mortgage
$250,000
Interest Rate
5.48%
Mortgage Type
New Conventional
Purchase Details
Closed on
Sep 29, 2004
Sold by
Monroe James T and Monroe Meredith L
Bought by
Sparks Gary D and Sparks Melodye P
Create a Home Valuation Report for This Property
The Home Valuation Report is an in-depth analysis detailing your home's value as well as a comparison with similar homes in the area
Home Values in the Area
Average Home Value in this Area
Purchase History
| Date | Buyer | Sale Price | Title Company |
|---|---|---|---|
| Flathers Richard James | $339,000 | -- | |
| Meyer James L | $372,000 | -- | |
| Sparks Gary D | $332,500 | -- |
Source: Public Records
Mortgage History
| Date | Status | Borrower | Loan Amount |
|---|---|---|---|
| Open | Flathers Richard James | $271,200 | |
| Previous Owner | Meyer James L | $250,000 |
Source: Public Records
Tax History Compared to Growth
Tax History
| Year | Tax Paid | Tax Assessment Tax Assessment Total Assessment is a certain percentage of the fair market value that is determined by local assessors to be the total taxable value of land and additions on the property. | Land | Improvement |
|---|---|---|---|---|
| 2024 | $2,174 | $16,640 | $4,600 | $12,040 |
| 2023 | $2,174 | $16,640 | $4,600 | $12,040 |
| 2022 | $1,968 | $16,370 | $4,600 | $11,770 |
| 2021 | $1,817 | $15,564 | $3,800 | $11,764 |
| 2020 | $1,813 | $15,564 | $3,800 | $11,764 |
| 2019 | $1,779 | $15,416 | $4,000 | $11,416 |
| 2018 | $1,818 | $154,160 | $0 | $0 |
| 2017 | $1,596 | $154,160 | $0 | $0 |
| 2016 | $1,576 | $13,972 | $0 | $0 |
| 2015 | $1,500 | $0 | $0 | $0 |
| 2014 | $1,500 | $406,900 | $100,000 | $306,900 |
| 2012 | -- | $406,900 | $100,000 | $306,900 |
Source: Public Records
Map
Nearby Homes
- 16 Gray Fox Loop
- 120 Pintail Ct Unit Pawleys Plantation
- 41 Redwing Ct
- TBD Green Wing Teal Ln
- 110 Whitetail Way Unit 4
- 179 Golden Bear Dr Unit C4
- 11 Bears Paw Way
- Lot 34 Old Augusta Dr
- 274 Masters Dr Unit Pawleys Plantation
- 75 Weehawka Way Unit 4
- 489 Golden Bear Dr Unit 1
- 141 Marsh Oaks Dr
- 14 Stillwood Dr Unit 2
- 39 Cutter Cove Unit Lot 9 Pawleys Landin
- 175 Safe Harbor Ave Unit Lot 105 The Bluffs
- 151 Safe Harbor Ave
- 163 Safe Harbor Ave Unit Lot 106 The Bluffs
- 1 Brace Dr
- 141 Twelve Oaks Dr Unit 5
- 272 Old Ashley Loop
- 35 Grey Fox Loop Unit Gated Golf Course Co
- 35 Grey Fox Loop
- 35 Grey Fox Loop Unit Pawleys Plantation
- 16 Grey Fox Loop
- 16 Grey Fox Cir
- 24 Grey Fox Cir
- 22 Grey Fox Cir
- 40 Grey Fox Cir
- 47 Grey Fox Loop
- 47 Grey Fox Loop Unit Country Club & Golf
- 18 Grey Fox Loop
- 59 Grey Fox Cir
- 50 Grey Fox Loop
- 99 Cameron Ct
- 70 Grey Fox Loop
- 90 Pintail Ct
- 82 Pintail Ct Unit Golf Course Communit
- Lot 12 Cameron Ct
- Lot 15 Cameron Ct Unit PAWLEYS PLANTATION
- C 11 Cameron Ct