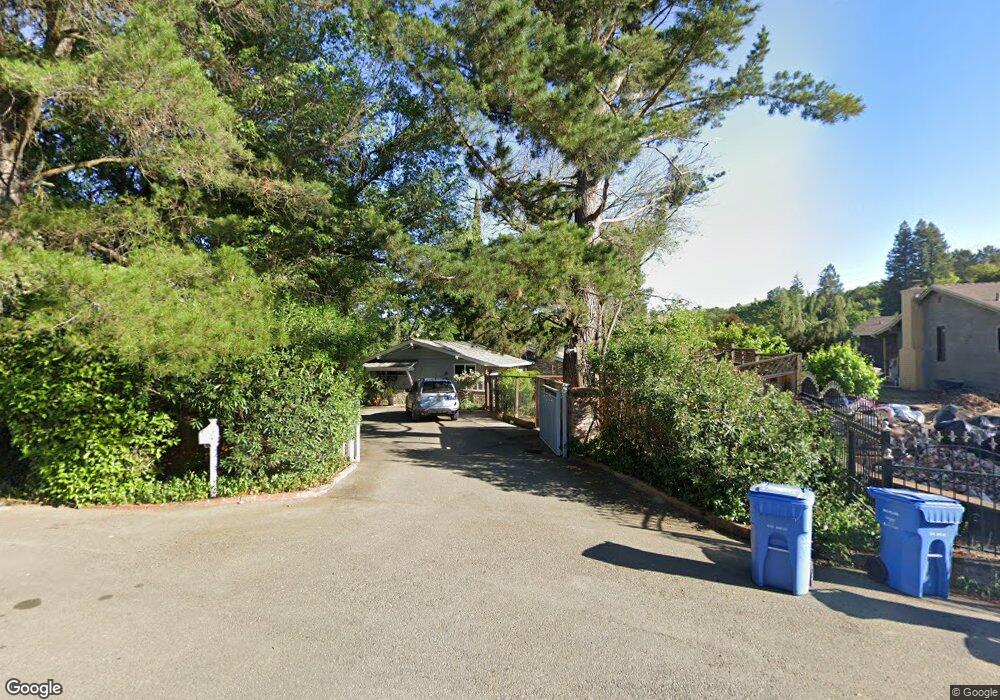
25 Grover Ct Walnut Creek, CA 94596
Estimated Value: $1,795,000 - $2,388,000
6
Beds
4
Baths
3,146
Sq Ft
$698/Sq Ft
Est. Value
About This Home
This home is located at 25 Grover Ct, Walnut Creek, CA 94596 and is currently estimated at $2,195,709, approximately $697 per square foot. 25 Grover Ct is a home located in Contra Costa County with nearby schools including Murwood Elementary School, Walnut Creek Intermediate School, and Las Lomas High School.
Ownership History
Date
Name
Owned For
Owner Type
Purchase Details
Closed on
May 17, 1996
Sold by
Reynolds Susan E
Bought by
Reynolds Susan E
Current Estimated Value
Home Financials for this Owner
Home Financials are based on the most recent Mortgage that was taken out on this home.
Original Mortgage
$120,000
Outstanding Balance
$6,713
Interest Rate
7.8%
Mortgage Type
Purchase Money Mortgage
Estimated Equity
$2,188,996
Purchase Details
Closed on
May 7, 1996
Sold by
Hemingway Patrick B and Hemingway Jill T
Bought by
Reynolds Susan E
Home Financials for this Owner
Home Financials are based on the most recent Mortgage that was taken out on this home.
Original Mortgage
$120,000
Outstanding Balance
$6,713
Interest Rate
7.8%
Mortgage Type
Purchase Money Mortgage
Estimated Equity
$2,188,996
Create a Home Valuation Report for This Property
The Home Valuation Report is an in-depth analysis detailing your home's value as well as a comparison with similar homes in the area
Home Values in the Area
Average Home Value in this Area
Purchase History
| Date | Buyer | Sale Price | Title Company |
|---|---|---|---|
| Reynolds Susan E | -- | Fidelity National Title Co | |
| Reynolds Susan E | $460,000 | Fidelity National Title Co |
Source: Public Records
Mortgage History
| Date | Status | Borrower | Loan Amount |
|---|---|---|---|
| Open | Reynolds Susan E | $120,000 |
Source: Public Records
Tax History Compared to Growth
Tax History
| Year | Tax Paid | Tax Assessment Tax Assessment Total Assessment is a certain percentage of the fair market value that is determined by local assessors to be the total taxable value of land and additions on the property. | Land | Improvement |
|---|---|---|---|---|
| 2025 | $9,375 | $764,159 | $313,967 | $450,192 |
| 2024 | $9,151 | $749,176 | $307,811 | $441,365 |
| 2023 | $9,151 | $734,487 | $301,776 | $432,711 |
| 2022 | $8,956 | $720,086 | $295,859 | $424,227 |
| 2021 | $8,714 | $705,967 | $290,058 | $415,909 |
| 2019 | $8,524 | $685,029 | $281,455 | $403,574 |
| 2018 | $8,237 | $671,598 | $275,937 | $395,661 |
| 2017 | $8,081 | $658,430 | $270,527 | $387,903 |
| 2016 | $7,925 | $645,521 | $265,223 | $380,298 |
| 2015 | $7,742 | $635,826 | $261,240 | $374,586 |
| 2014 | $7,647 | $623,372 | $256,123 | $367,249 |
Source: Public Records
Map
Nearby Homes
- 172 Rudgear Dr
- 189 Rudgear Dr
- 628 Sugarloaf Ct
- 4 Brookdale Ct
- 32 Pacer Place
- 421 Twin Oaks Ln
- 1092 Hillendale Ct
- 31 Arabian Ct
- 1310 Creekside Dr Unit 303
- 196 Crest Ave
- 50 Vista Ln
- 2128 San Miguel Dr
- 2101 Hillview Dr
- 1542 Hillgrade Ave
- 1305 Chesterton Way
- 2409 Lavender Dr
- 1096 Mountain View Blvd
- 2559 Romley Ln
- 1080 Scots Ln
- 1101 Scots Ln
- 15 Grover Ct
- 738 Old Stable Place
- 24 Grover Ct
- 732 Old Stable Place
- 744 Old Stable Place
- 184 Grover Ln
- 7 Grover Ct
- 18 Grover Ct
- 12 Grover Ct
- 194 Grover Ln
- 729 Old Stable Place
- 2129 Youngs Valley Rd
- 750 Old Stable Place
- 2100 Youngs Valley Rd
- 6 Grover Ct
- 735 Old Stable Place
- 2121 Youngs Ct
- 741 Old Stable Place
- 204 Grover Ln
- 2125 Youngs Ct