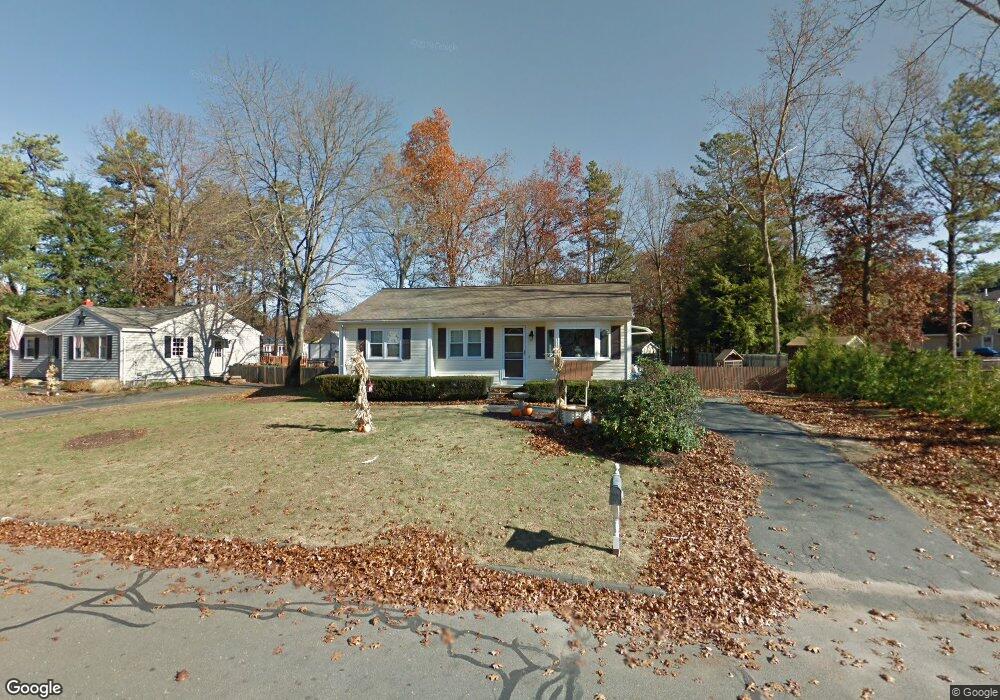
25 Gula Dr Easthampton, MA 01027
Estimated Value: $324,000 - $358,000
3
Beds
2
Baths
936
Sq Ft
$365/Sq Ft
Est. Value
About This Home
This home is located at 25 Gula Dr, Easthampton, MA 01027 and is currently estimated at $342,082, approximately $365 per square foot. 25 Gula Dr is a home located in Hampshire County with nearby schools including Easthampton High School, Calvary Baptist Christian School, and Tri-County Schools.
Ownership History
Date
Name
Owned For
Owner Type
Purchase Details
Closed on
Oct 31, 2008
Sold by
Patenaude Angela D and Patenaude Thomas M
Bought by
Patenaude Thomas and Patenaude T
Current Estimated Value
Purchase Details
Closed on
Nov 19, 1993
Sold by
Bergeron Kevanie A and Bergeron Gary M
Bought by
Patenaude Angela and Patenaude Thomas M
Home Financials for this Owner
Home Financials are based on the most recent Mortgage that was taken out on this home.
Original Mortgage
$92,475
Interest Rate
6.77%
Mortgage Type
Purchase Money Mortgage
Purchase Details
Closed on
Jul 25, 1988
Sold by
Marcil Theodore
Bought by
Bergeron Gary M
Home Financials for this Owner
Home Financials are based on the most recent Mortgage that was taken out on this home.
Original Mortgage
$78,750
Interest Rate
10.49%
Mortgage Type
Purchase Money Mortgage
Create a Home Valuation Report for This Property
The Home Valuation Report is an in-depth analysis detailing your home's value as well as a comparison with similar homes in the area
Home Values in the Area
Average Home Value in this Area
Purchase History
| Date | Buyer | Sale Price | Title Company |
|---|---|---|---|
| Patenaude Thomas | -- | -- | |
| Patenaude Angela | $90,000 | -- | |
| Bergeron Gary M | $105,000 | -- |
Source: Public Records
Mortgage History
| Date | Status | Borrower | Loan Amount |
|---|---|---|---|
| Open | Bergeron Gary M | $58,000 | |
| Previous Owner | Bergeron Gary M | $82,200 | |
| Previous Owner | Bergeron Gary M | $92,475 | |
| Previous Owner | Bergeron Gary M | $78,750 |
Source: Public Records
Tax History
| Year | Tax Paid | Tax Assessment Tax Assessment Total Assessment is a certain percentage of the fair market value that is determined by local assessors to be the total taxable value of land and additions on the property. | Land | Improvement |
|---|---|---|---|---|
| 2025 | $4,394 | $321,400 | $118,300 | $203,100 |
| 2024 | $4,244 | $313,000 | $114,900 | $198,100 |
| 2023 | $3,258 | $222,400 | $90,400 | $132,000 |
| 2022 | $3,676 | $222,400 | $90,400 | $132,000 |
| 2021 | $4,011 | $228,700 | $90,400 | $138,300 |
| 2020 | $3,950 | $222,400 | $90,400 | $132,000 |
| 2019 | $3,047 | $197,100 | $90,400 | $106,700 |
| 2018 | $3,133 | $195,800 | $85,400 | $110,400 |
| 2017 | $3,060 | $188,800 | $82,100 | $106,700 |
| 2016 | $2,943 | $188,800 | $82,100 | $106,700 |
| 2015 | $2,860 | $188,800 | $82,100 | $106,700 |
Source: Public Records
Map
Nearby Homes
Your Personal Tour Guide
Ask me questions while you tour the home.