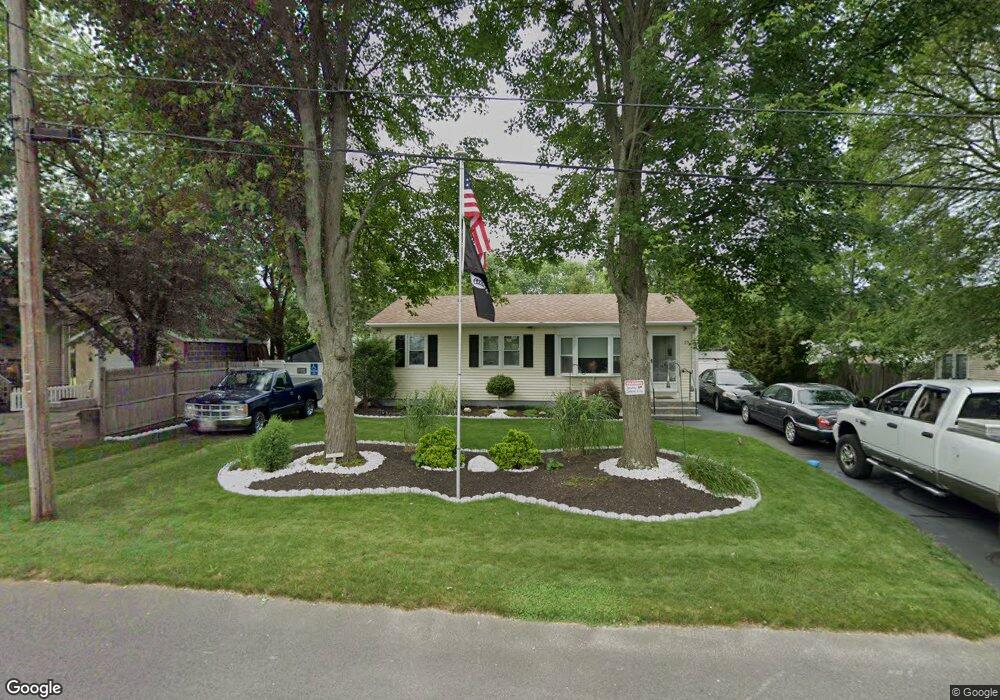
25 Holt St Warwick, RI 02889
Oakland Beach NeighborhoodEstimated Value: $362,363 - $382,000
3
Beds
1
Bath
988
Sq Ft
$378/Sq Ft
Est. Value
About This Home
This home is located at 25 Holt St, Warwick, RI 02889 and is currently estimated at $373,841, approximately $378 per square foot. 25 Holt St is a home located in Kent County with nearby schools including Saint Kevin School and Bishop Hendricken High School.
Ownership History
Date
Name
Owned For
Owner Type
Purchase Details
Closed on
Jan 28, 2015
Sold by
Procko Gail
Bought by
Procko Gail D and Procko Michael D
Current Estimated Value
Home Financials for this Owner
Home Financials are based on the most recent Mortgage that was taken out on this home.
Original Mortgage
$158,332
Outstanding Balance
$120,787
Interest Rate
3.81%
Mortgage Type
New Conventional
Estimated Equity
$253,054
Create a Home Valuation Report for This Property
The Home Valuation Report is an in-depth analysis detailing your home's value as well as a comparison with similar homes in the area
Home Values in the Area
Average Home Value in this Area
Purchase History
| Date | Buyer | Sale Price | Title Company |
|---|---|---|---|
| Procko Gail D | -- | -- |
Source: Public Records
Mortgage History
| Date | Status | Borrower | Loan Amount |
|---|---|---|---|
| Open | Procko Gail D | $158,332 | |
| Previous Owner | Procko Gail D | $140,000 | |
| Previous Owner | Procko Gail D | $110,000 |
Source: Public Records
Tax History Compared to Growth
Tax History
| Year | Tax Paid | Tax Assessment Tax Assessment Total Assessment is a certain percentage of the fair market value that is determined by local assessors to be the total taxable value of land and additions on the property. | Land | Improvement |
|---|---|---|---|---|
| 2025 | $4,310 | $339,400 | $99,900 | $239,500 |
| 2024 | $4,238 | $292,900 | $86,900 | $206,000 |
| 2023 | $4,156 | $292,900 | $86,900 | $206,000 |
| 2022 | $3,810 | $203,400 | $51,000 | $152,400 |
| 2021 | $3,810 | $203,400 | $51,000 | $152,400 |
| 2020 | $3,810 | $203,400 | $51,000 | $152,400 |
| 2019 | $3,810 | $203,400 | $51,000 | $152,400 |
| 2018 | $3,160 | $151,900 | $51,000 | $100,900 |
| 2017 | $3,074 | $151,900 | $51,000 | $100,900 |
| 2016 | $3,074 | $151,900 | $51,000 | $100,900 |
| 2015 | $3,007 | $144,900 | $56,400 | $88,500 |
| 2014 | $2,907 | $144,900 | $56,400 | $88,500 |
| 2013 | $2,868 | $144,900 | $56,400 | $88,500 |
Source: Public Records
Map
Nearby Homes
- 17 Holt St
- 574 Oakland Beach Ave
- 22 Wood St
- 28 Wood St
- 26 Holt St
- 18 Holt St
- 217 Pequot Ave
- 215 Pequot Ave
- 586 Oakland Beach Ave
- 4 Wood St
- 590 Oakland Beach Ave
- 12 Holt St
- 550 Oakland Beach Ave
- 563 Oakland Beach Ave
- 237 Pequot Ave
- 2 Holt St
- 209 Pequot Ave
- 598 Oakland Beach Ave
- 544 Oakland Beach Ave
- 81 Coburn St